NY Elections, Census, and Redistricting Update 3/24/26 – NY Law School City Land

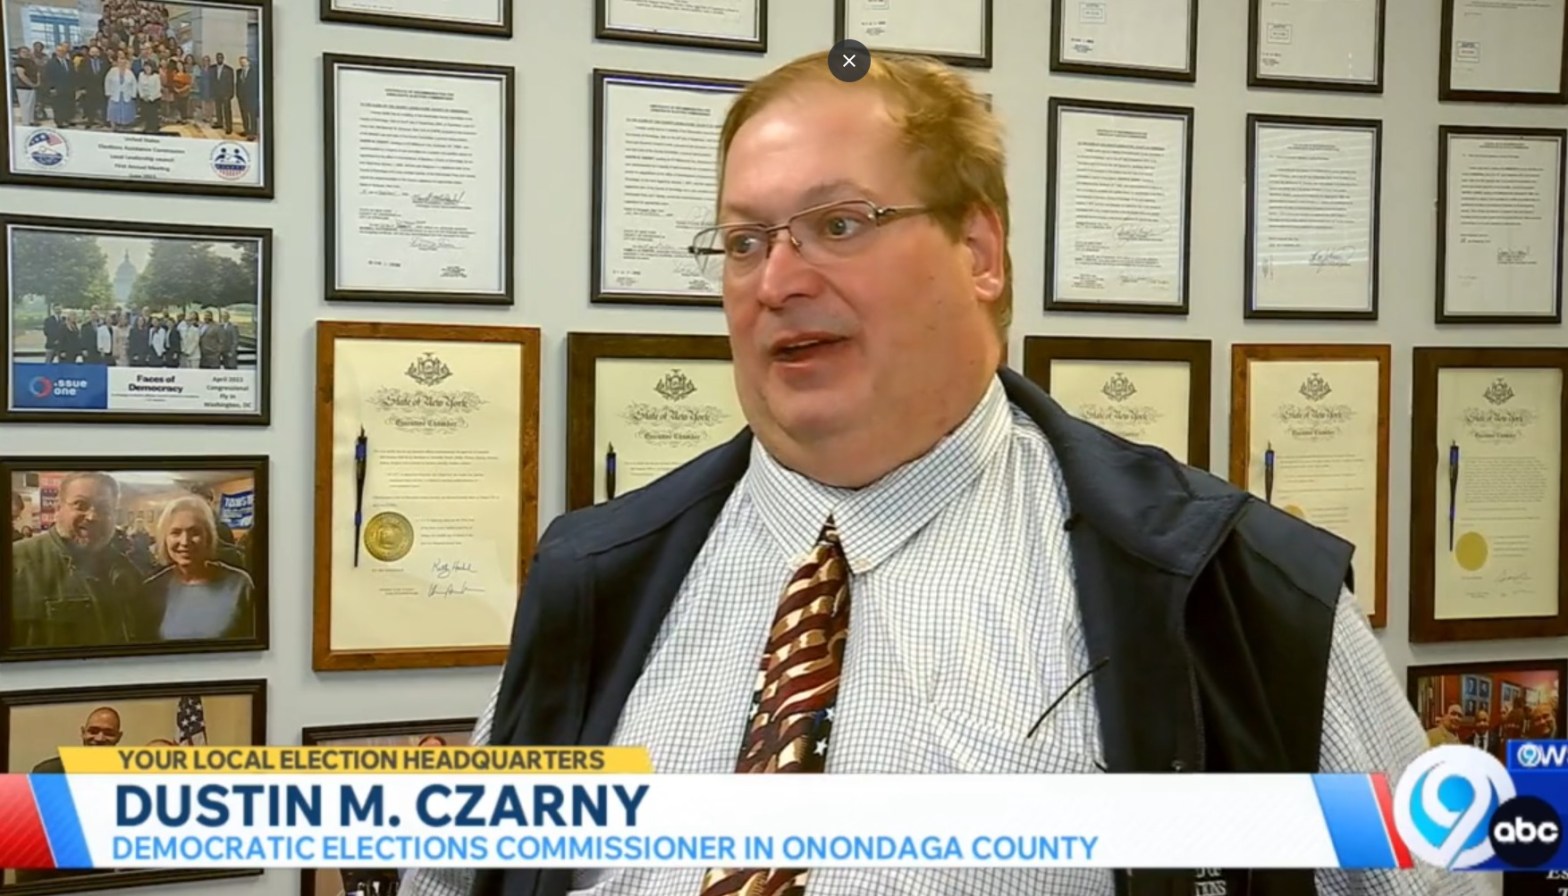
“According to Dustin Czarny, the Democratic elections commissioner of Onondaga County, under this bill, voters would need to provide a passport or birth certificate when registering and at the polls because New York driver’s licenses do not attest to citizenship on their face.”

Subscribe to dustinczarny.com for all content and election news updates

The Weekly Wonk: New York’s 5th Judicial District 2026

Welcome back to the #weeklywonk. This is my weekly article on dustinczarny.com about statistics and data. Each week I dive into the electoral and registration data on a political subdivision or election relevant to 2026. Currently I am in the middle of diving into the New York Stat races appearing on the Onondaga County Ballot this year. This week I am diving into part two of this nine-part series, the NYS Supreme Court race in the fifth judicial district.

We select our Supreme court seats in New York (which is the lowest court level) in judicial districts. These massive districts are the largest political subdivisions in New York State. The 5th Judicial district spans six counties, Herkimer, Jeffereson, Lewis, Oneida, Onondaga, and Oswego County. According to the NYS Board of Elections February 20, 2026, enrollment reports it has 642,505 voters. Republicans own the plurality of it with 226,484 voters (35%). Democrats come in second with 197,361 voters (31%), and non-enrolled third with 176,456 voters (28%). Other (25,023 4%), Conservative (11,633 2%) and Working families (2,9721 <1%) round out the enrolled active voters. Onondaga County is the largest plurality of the district with 48% (3098,109) of the voters. Oneida is the second most populace county with 215 (136,887) of the voters. Oswego (75,179, 12%), Jefferson (62,247%), Herkimer (42,452 6%), and Lewis (17,631 3%) make up the rest of the district.

The 5th Judicial district is behaving the way New York State has in terms of adding voters. Some growth started with the 2016 election and online voter registration with the DMV.  The largest growth of voters has happened since 2020 thanks to the reforms put in place by the Democratic controlled legislature to make it easier to register to vote and stay registered to vote in New York. Since 206 the 5th Judicial district has added 45,506 voters which is a growth rate of 7.62%. This nearly mirrors the growth rate of Onondaga County which is the largest county and has an enormous impact on the district.

Here in this heat map of the 5th Judicial district, we really see how this district becomes so balanced. Onondaga County acts like a blue anchor on the district in the moderate Democrat lean category of 10-14%. Oneida has a slight GOP lean of 5-9% Jefferson is a strong GOP lean in the 15-19% category. Herkimer, Lewis, and Oswego are in the Overwhelming GOP lean category of +20%.

In the county break down we truly see how Onondaga County balances the district and gives Democrats a fighting chance  All four of the small GOP counties we see the signs of GOP dominance with non-enrolled outnumbering the Democrats and overwhelming GOP enrollment advantage (Lewis +36.25% GOP, Herkimer +25.20$+% GOP, Oswego +24.38% GOP, Jefferson +19.62% GOP).  Oneida represents a more typical GOP county with a 9.10% GOP advantage and Democrats in second. Onondaga is a strong blue county with a +10.05% DEM advantage and non-enrolled outnumbering the GOP.

When we look at the partisan trends of the 5th Judicial district we see a unique trend. Up until 2015 Democrats were closing the gap with the GOP, mostly through the GOP losing voters more than Democrats gaining. However, once Trump entered the political lexicon in 2016, we saw republicans, led by the 5 GOP counties, had a resurgence over the last ten years as Democrats have remained stagnate. Democrats have lost 670 voters over the last ten years as while the GOP has added 12,382 voters. However, the non-enrolled is still the highest grossing by far adding 39,942 voters. When looking at the effect of conservative and WFP voters we really see the closest this district came to ideological balance was 2015 when the right (republicans and Conservatives) had a just a +2.90% In fact 2025 was the highest ideological advantage for the right with +6.11% but it also corresponds to the largest defeat when Democrats won 3 of 4 Supreme Court seats.

We can ee that despite the ideological balance of the district shifting to the right, in federal years Democrats have performed well overcoming their disadvantage. In fact, they have one plurality in all four of our comparative races. In the 2024 Senate race the district performed the best for Democrats at +2.03% advantage. In the other three races they were much closer. The 2024 Presidential Race Democrats a +.62% advantage. The 2022 Senate Democrats had a +.29% advantage. The 2022 Governors’ race Democrats had +.61% advantage. This bodes well for Democrats going into 2026 which has a one Supreme Court seat on the ballot. Delegates will choose candidates during the August conventions.

That is, it is for this week’s edition of the #weeklywonk. Next week I dive into what has been the most popular race in federal elections, New York’s 22nd congressional district. After multiple close elections, it flipped in 2024 for the first time since 2014. Will Democrats be able to repeat in this district for the first time since 1980? Tune in and find out. As always you can subscribe to dustinczarny.com for all content and election news updates.

Commissioner in a Car: General Election Polling Places are Here!

On this week’s episode I talk about the release of the 2026 General Election polling place. I detail why we release them so early and what goes into choosing a polling place. I also detail the very few changes we have from last year and why changes have to be made from time to time. Enjoy.

Subscribe to dustinczarny.com for all content and election news updates.

The Weekly Wonk: New York State 2026

Welcome back to the #wweeklywonk. This is my weekly column on dustinczarny.com on data relevant to Onondaga County and the State of New York, each week I dive into the electoral, registration, and performance data surrounding a political subdivision or election event relevant to our home here in Central New York. 2026 is a gubernatorial year and that means we have statewide elected offices running. Today I am looking at New York State as a whole. This is the first part of my 9-part series looking at New York State offices on the ballot this year in Onondaga County. So, join me as I look at the Empire State as we head into 2026 and how it relates to Onondaga County.

On February 20, 2026, the NYS Board of Elections pulled registration data from every County board of Elections. This gives us a good opportunity to look at how New York Stands currently with up-to-date data. As of February 20, 2026, New York has 12,547,142 active voters. Democrats are the dominant plurality of 6,002,006 voters (48%). Non-enrolled are second in New York with 3,187,610 voters (25%). Republicans have fallen to third in New York with just 2,835,976 (23%). Rounding out the population are the other category (301,469 2%), Conservative (160,464 1%), And Working Families (59,617 1%). This gives Democrats a +25.23% Democratic enrollment advantage statewide. One of the most controversial topics in New York is breaking it up into regions. To avoid this, I am using the regions as designated by the New York “Independent” redistricting commission. It is evident that New York City accounts for 40% of the state’s active voters, highlighting its dominant influence within New York. Long Island (17%) and the Mid-Hudson Valley (13%) follow this. The rest of the regions across upstate New York range from 2-7% each.

This chart shows the number of active registered voters in the State of New York in the millions. Currently New York has the second highest total of active registered voters going back to 2005. The season I cut this off in 2005 is the tracking of active and inactive voters started at that point so data before that date is not really comparing apples to apples. The changes in registration options clearly show the growth in registered voters in New York. Online voter registration began at the NYS DMV in 2016. After Democrats gained control of the NYS legislature in 2019, they passed measures like statewide transfers and a constitutional 10-day registration deadline, making it easier for voters to register and update their status. This year New York is finally launching Automatic Voter Registration with the DMV that will increase voter registration further. Since 2016 New York has added 1,070,708 voters which is a growth rate of 9.34%. Onondaga County trails the state average during that period with a growth rate of only +7.63% during this time.

In terms of partisan trends, we see a similar trend line that we saw in Onondaga County. Democrats since 2005 have grown and Republicans have remained stagnate. The big growth category though is the non-enrolled. In 2020 the non-enrolled overtook the republican category to become second place in New York. When we dial in on the last ten years since 2016, we see this trend hold. Democrats added approximately 370k voters. Republicans have added 170k voters reversing a trend of losing voters from 2005. However, the non-enrolled grew the most again, adding over 710k voters. When we factor in the Working Families and Conservative enrollment Democrats still have a 24.43% advantage over the GOP. We do see that Democratic advantage peaked in 2021 after the end of the first Trump administration at +47.24%. There had been a steady decline until 2024. We are now starting to see another levelling off and signs of increase in the second trump term.

People often fail to recognize the rich diversity found throughout New York State. Here is the heat map of New York counties in terms of partisan advantage. Obviously, we see a great deal of blue in NYC and the counties downstate. But even in the upstate regions we see a great deal of counties with large clue leanings, in counties hosting large upstate cities like Buffalo (Erie), Rochester (Monroe), Syracuse (Onondaga), & Albany (Albany). Schenectady, Rensselaer, and Columbia counties make up the capital region. Tompkins County is distinctive due to Ithaca’s influence on its development. No matter what region of New York we look at there is at least one county in the region that at least is borderline Democrat with the lone exception of the Mohawk Valley.

When people talk about New York State, they break it into three different macro regions: New York City, Downstate, and Upstate. For terms of this discussion, I will wade into the discussion of where upstate New York starts. Upstate New York starts Above the mid-Hudson line. I combined all regions north of mid-Hudson into the upstate region (Capital Region, Central New York, Finger Lakes, Mohawk Valley, North Country, & Western New York). Downstate are the regions directly bordering NYC (Mid-Hudson & Long Island). Democrats do well in downstate with a solid +10.29% advantage and non-enrolled are starting to overtake the GOP. Of course, in NYC the Democrats are dominant with a +54.69%. There are more Democrats alone in NYC as registered voters in the other two macro-regions individually.

When we investigate the two regions in the downstate macro-region (mid-Hudson and Long Island) we do see a definite diversity. Long Island, which consists of Nassau and Suffolk Counties, is just barely Democratic with a margin of +4.05%. This political leaning is evident in the composition of their county governments, as well as their congressional and state representatives. Counties in the Mid-Hudson Valley, located outside New York City, show strong backing for the Democratic Party. Westchester, Ulster, and Rockland counties contribute to a notable regional shift toward the Democratic Party, reflected in a strong advantage of +18.59%. In Mid-Hudson we see the telltale sign of non-enrolled significantly outnumbering the GOP.

Since I defined upstate into one macro-region I wanted to show the individual regional breakdown as well. There are seven regions inside upstate, three have Democratic leans, two have GOP leans, and one, our home of Central New York, is almost dead even. Western New York is the most Democratic upstate region with +9.53%. The Capital region is second at +8.25% but is the only region where non-enrolled outnumbers the GOP. The Finger Lakes has a borderline Democratic advantage of +2.57%. Central New York is smack in the middle with less than two hundred voters separating Democrats and Republicans only a +.04% for Democrats. The GOP in the southern tier only just leans GOP +5.44% thanks to the heavy Democrat lean of Tompkins County. The North Country region is a solid republican lean (+11.06% GOP). The Mohawk valley, the only region without a blue leaning county, Has the biggest GOP advantage of +14.37%.

Lastly, we will look at four of the statewide races over the last two federal cycles and how Onondaga County relates to New York State as whole. In 2024 New York voted for Kristen Gillibrand for Senate by +17.48% while Onondaga County voted just to the left at +20.54%. In 2024 New York voted for Kamala Harris for President by +12.41% while Onondaga County voted more to the left at +17.18%. In 2022 New York voted for Charles Schumer for President by +13.73% while Onondaga County voted solidly to the left at +17.60%. In 2024 New York voted for Kathy Hochul for Governor by +6.34% while Onondaga County voted just to the left at +7.75%. On average of these four races New York voted for the Democrat candidate +12.49% while Onondaga County was +15.77%. So, on average Onondaga County is remarkably similar to New York in these races with just 2-3 points to the left.

That is, it is for this week’s edition of the #weeklywonk. Next week I will look at the biggest political subdivision in New York, the Supreme Court district. Made up of six different counties, it is even larger than congressional district in terms of registered voters. This is part 2 of my 9-part series on New York races running in Onondaga County. As always you can subscribe to dustinczarny.com for all content and election news updates.

The SAVE America Act could reshape New York state voting – Newschannel 9

“Our driver’s licenses in New York would not be valid proof of citizenship because they do not attest to citizenship on the face of the driver’s license itself, so they would either have to provide a passport or a birth certificate,” Czarny said.

https://www.localsyr.com/news/local-news/save-america-acts-possible-impact-on-nys-voting/

Commissioner in a Car: Village elections are coming up but is anyone running?

Today I talk about the village elections happening on Wednesday March 18, 2026. Three villages, Manlius, Marcellus, and Minoa are holding their village elections this year. Why on a Wednesday? Why in March? Why do they have different polling hours? Why do villages get to choose their election days and how can it be changed? The answer to those questions and more in this week’s episode. Enjoy.

Subscribe to dustinczarny.com for all content and election news updates
The Weekly Wonk: The Town of Spafford 2026

Welcome back to the #weeklywonk. This is my weekly data article that I host on dustinczarny.com. Each week I dive into the electoral and registration data that affect races in Onondaga County and New York State. I am at the end of my 6-part series looking at towns who nominate Democratic candidates by petitions that started last Tuesday. This week is part 6 of this series investigating the Town of Spafford. At first look it is a small rural town that should lean Republican. In practice it is one of Onondaga County’s most evenly contested towns.

The town of Spafford is one of the smaller towns in our county with just 1,346 voters. There are 370 Democrats with just 27%. The Republicans hold the plurality with 577 voters (43%). The non-enrolled in this town is in third place with just 325 voters (24%). The Other (49, 4%), Conservative (21, 2%), and Working Families (4. Zero percent) round out the population. Spafford is so small it only has two election districts in it. Election district one in the northwest portion of the town is the largest with 706 voters (52%). Election district two is in the southeastern portion of the town and has 640 voters (48%).

Not only is Spafford one of the smallest towns, but it is also growing at a rate slower than the rest of Onondaga County. Like most areas of Onondaga County and indeed New York state. The growth came about after 2019 with easier voter registration laws thanks to the Democratic takeover of New York State government. Looking back ten years, the Town of Spafford added sixty-seven voters, a growth of 5.24%. This is slightly bellowing the growth rate for Onondaga County as a whole (+7.63%) during the same period.

The Town of Spafford’s small stature makes it hard to delve deep into its different areas. However, even though there are only two election districts, we do see diversity. The. northern more populous election district is only a lean Republican district. The GOP has a +9.92% enrollment advantage here. The southern less populous district is one of the more GOP dominant eds in the county. The Republicans have a +21.41% enrollment advantage here. Despite the GOP dominance, in neither election district do the Democrats drop below second place. That is an important distinction in this rural town.

Spafford is a pretty static town. Despite this Democrats are making gains in this town. Since 2016 the Democrats have gained thirty-seven voters. The republicans have lost nine voters during that time. The non-enrolled have gained fifty-eight voters. In small towns the Conservative population can have a larger effect in tilting the town to the right. Even here Democrats and the left are making gains. In 2009 The combined GOP and Conservative dominance of Spafford gave a Democratic disadvantage of -23.79%. It has shrunk to -16.64% this year. Another sign that Spafford is not as republican as you might suspect.

Spafford has another distinction besides being the most competitive town. It is also the oldest. The average voter in Spafford is 54.93 years old. That is much older than the Onondaga County average of 50.87 years old. In fact, it is the oldest town in Onondaga county and as you might expect the 91+ age group is the largest. We do find diversity in the partisan makeup of the age groups. Like always the Democrats do better under fifty age groups and the GOP does better in the older groups. Still every group the GOP leads, even in the 18-30 group. And we do not see the dominance of the non-enrolled in the youngest groups like we have with other towns.

The most surprising facet of Spafford is its ability to elect Democrats despite the seeming registration dominance of the Republican party. In the past 15 years, the town of Spafford elected Democrats, sometimes gaining control of both the town board and Supervisor positions. In 2025 the pendulum again swung back to the Democrats winning the Supervisor race by 10.83% and gaining control of the board. When we look at the six comparative races, we see that Spafford lives up to the very epitome of a battleground town. Democrats won the 2024 Presidential and Congressional race as well as the 2022 congressional race. Republicans won the 22021 Supreme Court and 2023 County Clerk along 2022 Governor’s race. All were within five points except the 2023 County Clerk. The GOP averages a 3.37% margin of victory wh9ich is about a ten-point swing form the county average of Democrats +8.73%.

That is, it for this edition of the #weeklywonk. This ends my 6-part series on towns who petition for Democratic candidates in 2026. Next, I start another series, this time on the New York State races. This 9-part se. s will examine the New York, fifth judicial, Congressional, and six state legislature races in our county. Next week we begin our journey by looking at New York State as a whole. As always you can subscribe to dustinczarny.com for all content and election news updates.

Commissioner in a Car: Elections Don’t Need a SAVE

This week’s episodes focuses on the Save America ACT and what a disaster it would be for NY Elections. I go through it along with the MEGA proposals and possible executive orders as well as address the suspect constitutionality of it all. Enjoy,

Subscribe to dustinczarny.com for all content and election news updates
The Weekly Wonk: The Town of Salina 2026

Welcome back to the #weeklywonk. This is my weekly data article that I host on dustinczarny.com. Each week I dive into the electoral and registration data that affect races in Onondaga County and New York State. I am in the middle of my 6-part series looking at towns who nominate Democratic candidates by petitions that started last Tuesday. This week is part 5 of this series investigating the Town of Salina. Home last year to the Salina Sweep that saw Democrats take over the town government and both county legislature seats that cross into this town. This town has become the bell weather town for politics in Onondaga County.

One of the reasons I consider Salina to be the bell weather town of Onondaga County is how similar the makeup is to the County as a whole. As of February 26, 2026, Salina had 22,152 voters. 7,874 voters are Democrat (35%). In second place are the non-enrolled voter block of 7,014 voters (32%). The 5,884 Republicans (27%) are in third place. Voters enrolled in various other parties (878, 4%), Conservative (386, 2%) Working Families (116, <1%) make up the rest of the town. The Democrats have a +8.98% partisan difference which is like Onondaga County as a whole (Dem +10.03%). Salina is one of only two towns in Onondaga County that let their Town Boards in districts (called wards) as opposed to town wide. The four town wards are of varied sizes because Salina did not redistrict in 2021 keeping the same maps even though the spread was only slightly below the legal rate of 5% population. It is highly likely that redistricting will be necessary in 2031.

Salina has grown a little faster than Onondaga County as a whole. Since 2016 Salina has added 745 voters. That is a growth rate of 1045%. This is slightly ahead of the pace of Onondaga County of 7.63%. Like most areas of our county, we saw major growth happen between 2020 and 2024. This is due to the simpler registration procedures established by laws enacted from 2019 to 2023. After the high point of the 2024 presidential election, participation typically drops.

When looking at the heat map of Salina we can see there are no election districts where the GOP even have borderline registration advantage. We do, however, see a pattern with Salina. In the northwestern region of Liverpool, Democratic candidates are significantly preferred, with certain precincts demonstrating a 15-19% advantage. The village of Liverpool serves as an example of this. There are pockets of heavier democratic leans in the middle and eastern portion of the town. However, the farther west we go the more likely the election districts have a borderline Democratic lean.

Focusing in on the four wards of Salina there are few differences between them All four wards have Democratic leans with Ward 1 having a +11.53% partisan advantage, followed by Ward 4 (+10.67%) then ward 3 (+6.98%) and last ward 2 (+6.50%). All four wards the GOP are in third place of the registered voters, however ward three has the rare instance where the non-enrolled outnumber both the Democrats and the GOP individually. Each district now has a Democratic officeholder whose views match the area’s voter registration patterns, something that has not happened in years.

Salina has always been a borderline town, despite the GOP dominance in its office holders. In 2009, both Democrats and Republicans held equal representation in political affiliation within the town. This was steadily changing into 2016. Since 2016 though Democrats added 602 voters. The republicans have lost 199 voters since 2016. The non-enrolled is the biggest gainer during that period with +1006 voters. When looking at the ideological trend we see that the left (Democrats and WFP) has steadily grown in dominance when compared to the right (GOP and Conservatives). The current advantage of 7.76% is the highest on record, though tied with 2021.

This year I am adding age to the metrics I am using to analyze political subdivisions this year. The average age of Salina voters is 51.78 years old, which is slightly higher that Onondaga County average of 50.87 years. The interesting part of Salina is the oldest age group of 71+ (20%) is the most populous but closely followed by the youngest age group of 18-30 (18%). We also see the dominance of the non-enrolled in the younger age groups. The non-enrolled outnumber the GOP in all three age groups below 50 but also outnumber the Democrats in the 18-30 and 41-50 age groups. Still Democrats dominate all three younger groups in enrollment advantage. The three age groups over fifty-one are borderline Democratic groups with the traditional order of Democrats leading followed by GOP in second place and the non-enrolled in third.

Another piece of evidence for Salina being the bell weather town for Onondaga County is the performance in the six comparative races we are using this year. The only GOP to win these six races was the impossibly close 2023 County Clerk race, and only by 1.67% (as opposed to the county overall result of Democrat +0.33%). Every race Salina ran just 2-3% to the right of Onondaga County, one of the closest we have analyzed so far. In Salina, the six comparative races had an average margin of Democrat +7.11%, which is statistically similar to Onondaga County’s average of Democrat +8.73%. This is why the Supervisor race in Salina was such a surprise with Raul Huerta winning by 15.46% as part of the Salina sweep.

That is, it is for this week’s edition of the #weeklywonk. Next week I finish my 6-part series looking at towns that nominate democratic candidates by petition. I will look at the small town of Spafford that has shown a large history of bucking their republican enrollment to elect Democratic representatives. Next, I will look at the big races this fall as the NYSBOE has released their enrollments for multi county districts so we can now look at NY State, Congress, State Senate and assembly and Supreme Court races on the ballot this fall. As always you can subscribe to dustinczarny.com for all content and election news updates.

Commissioner in a Car: Petition Season Begins

This week’s episode I talk about the upcoming start of the Designating petition period on Tuesday. I go over how we use designating petitions to get on the ballot, how they create primaries, and what goes into determining minimum signatures. Enjoy.

Subscribe to dustincczarny.com for all content and election news updates