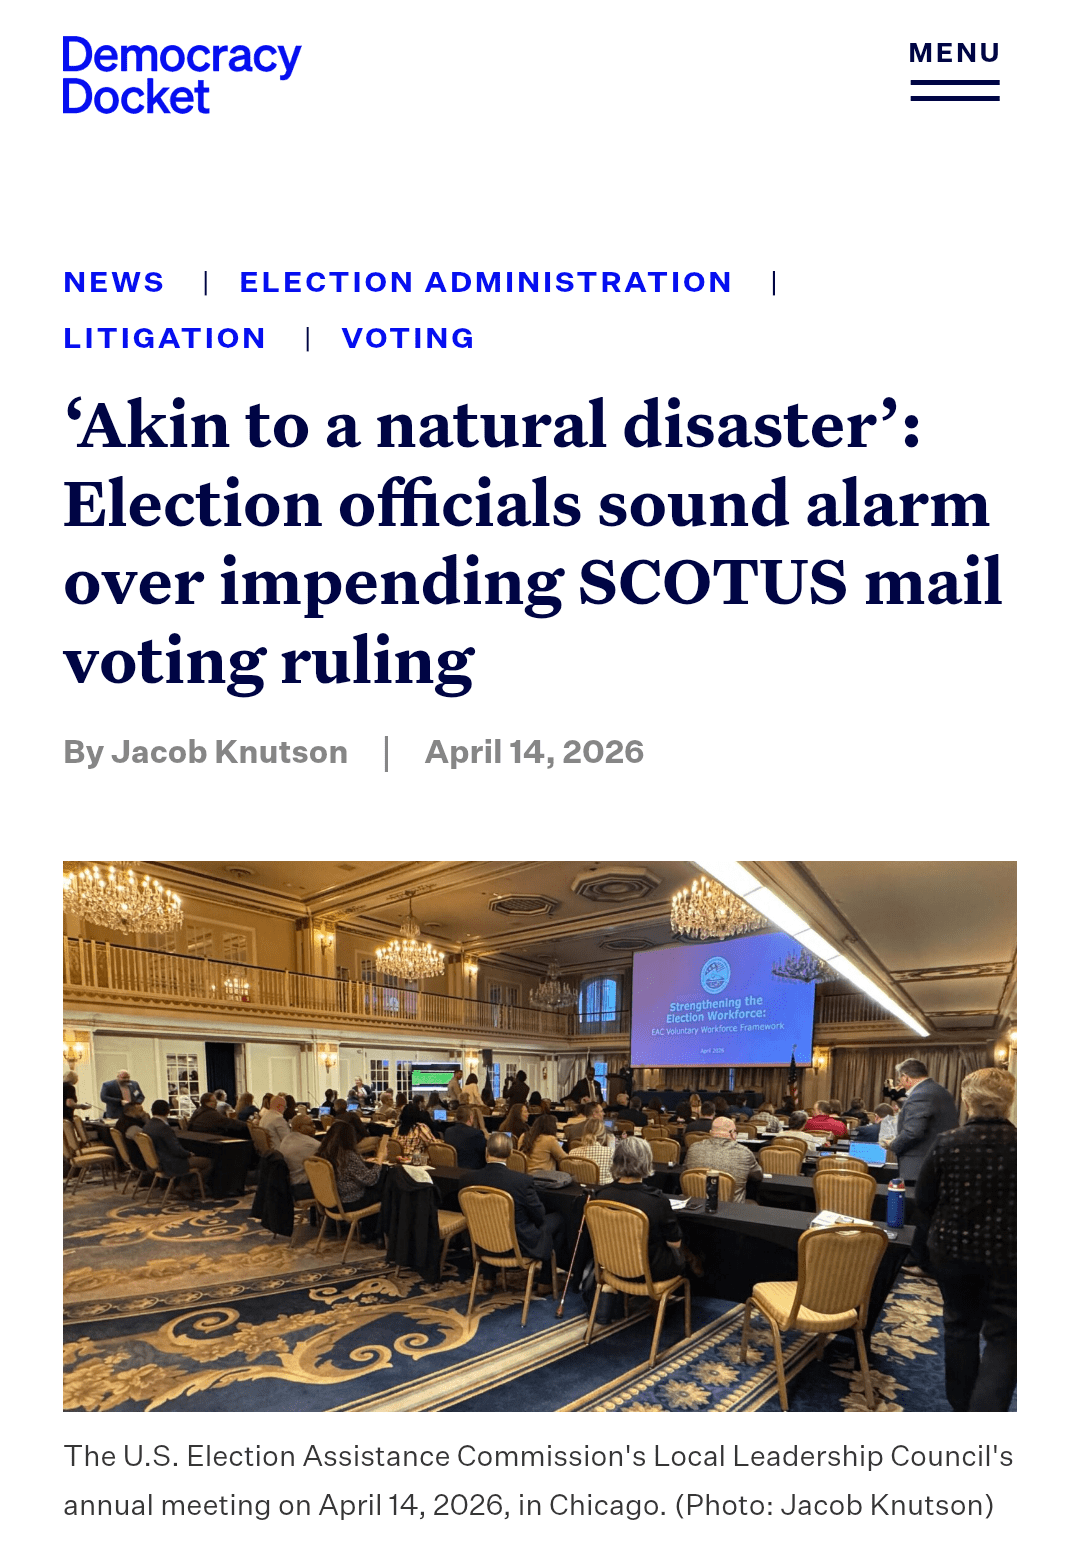
I am attending the U.S. Election Assistance Commission this week as a representative of the Local Leadership Council. I had the opportunity to voice my opinion on the pending SCOTUS decision on mail in ballots received after election day. It was covered in Democracy Dockett.
Commissioner in the Car: Petitions and Primaries

In this week’s episode I talk about the end of the petition season. over 155 petitions and 160 candidates have filed to run in the primary and general elections. I talk about the process and what is next in the petition process. Enjoy.
Subscribe to dustinczarny.com for all content and election news updates.
The Weekly Wonk: 48th NY Senate 2026
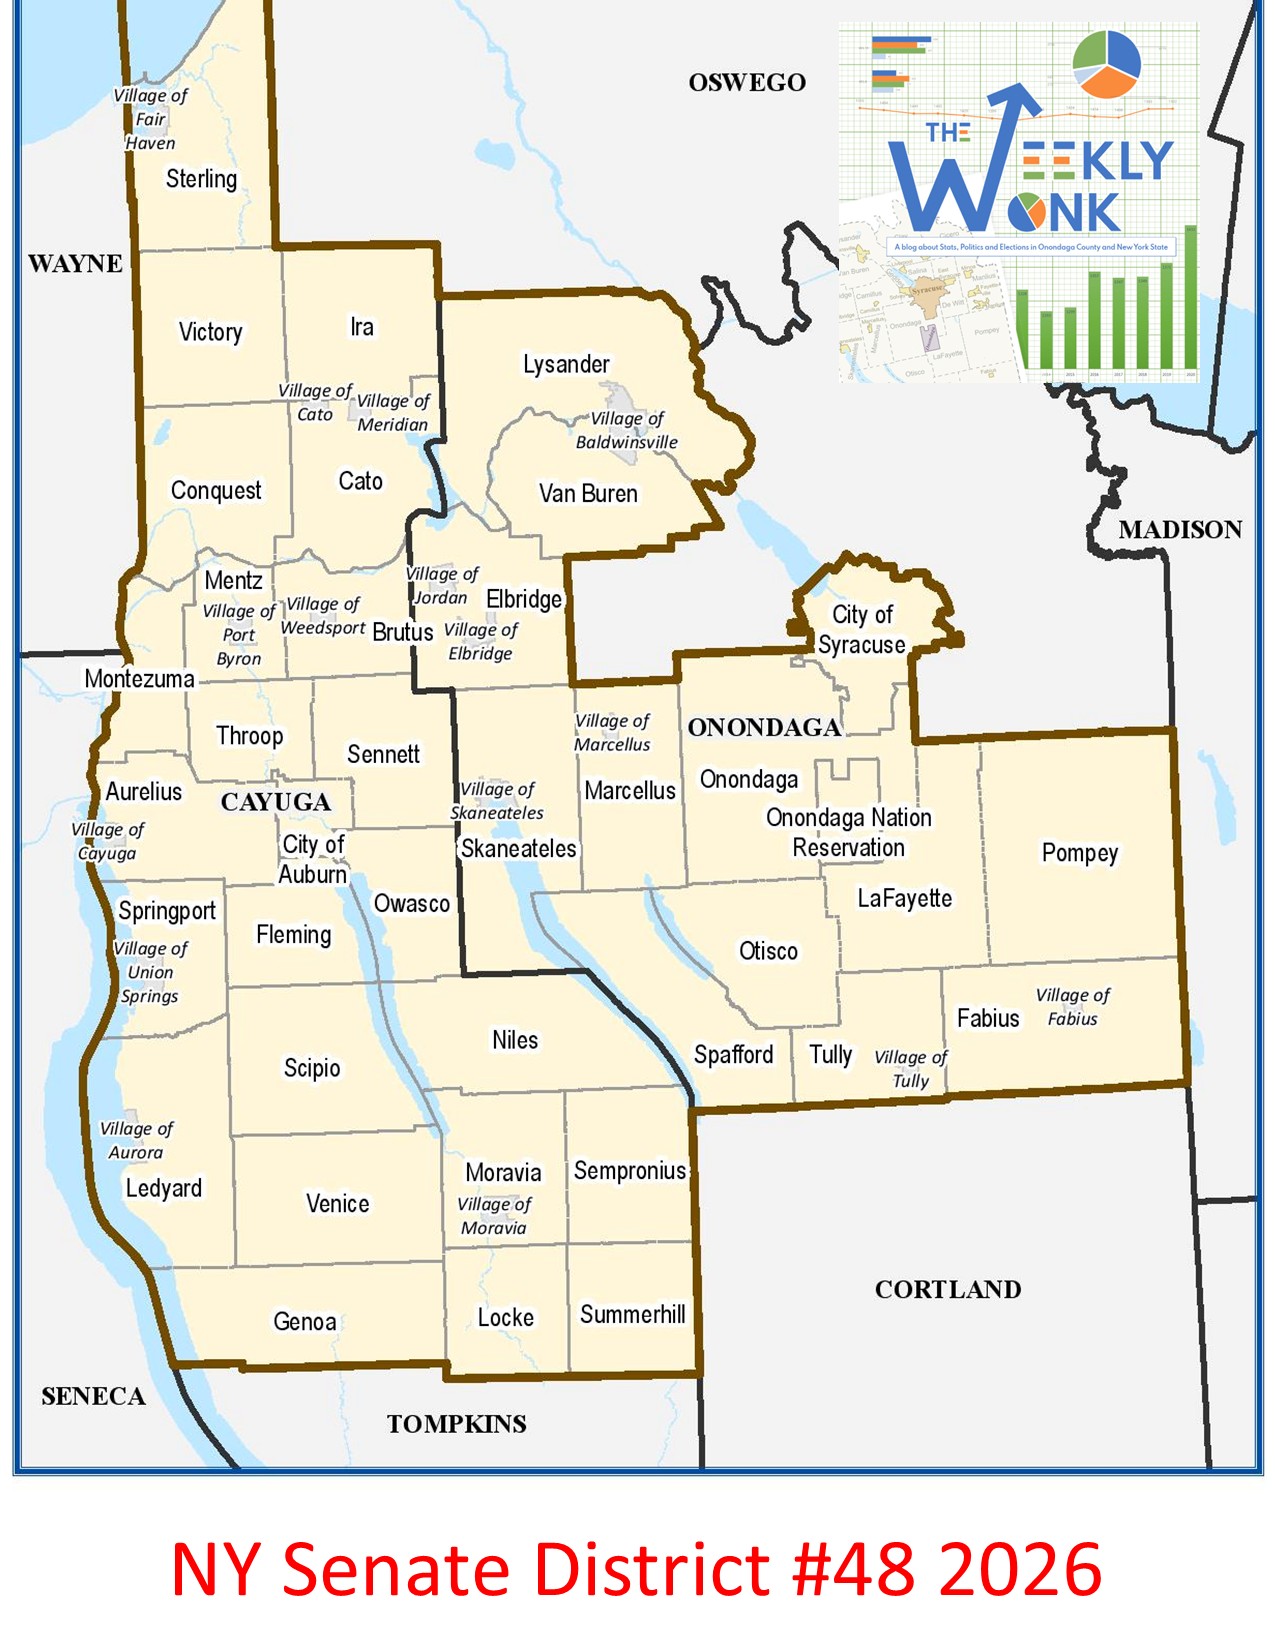
Welcome back to the #weeklywonk. This is my weekly column on data and statistics that I publish on dustinczarny.com. Each week I dive in the registration and electoral data around a political subdivision or electoral event affecting Onondaga County. I am currently in the middle of my nine-part series of New York State offices running this year. This week I focused on the Syracuse based NY Senate district. The current names NYS #48 has had a tumultuous past 30 years filled with twists and turns, but the data has been there through it all.
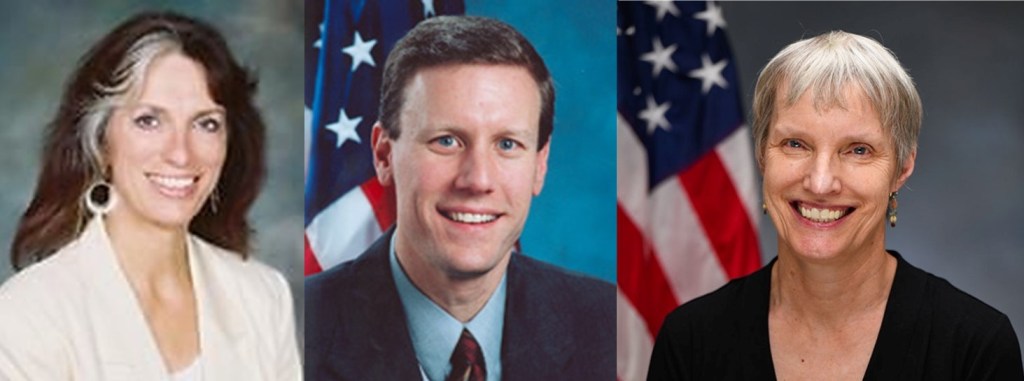
This district has had more heel turns than a Martin Scorsese movie. Onondaga County has always had two Senate districts. Since 2010 there have been two districts, the Syracuse based district, and the suburban based district. The Syracuse based district has changed parties, but not by traditional means. Longtime Democratic Senator Nancy Lorraine Hoffman shortly after the 1998 election stunned Democrats by defecting to the Republican party. The district stayed in Republican hands until Dave Valesky’s beat Nancy Lorraine in 2004. The district stayed in Democratic hands until 2011 when Senator Valesky left the Democratic caucus, but not the party, to join the NY IDC which gave effective control of the Senate to the Republicans. Then in 2018 current Senator Rachel May primaried Dave Velesky and won ushering in the death of the DC and giving Democrats full control of the legislature and New York government for the first time since 2006.
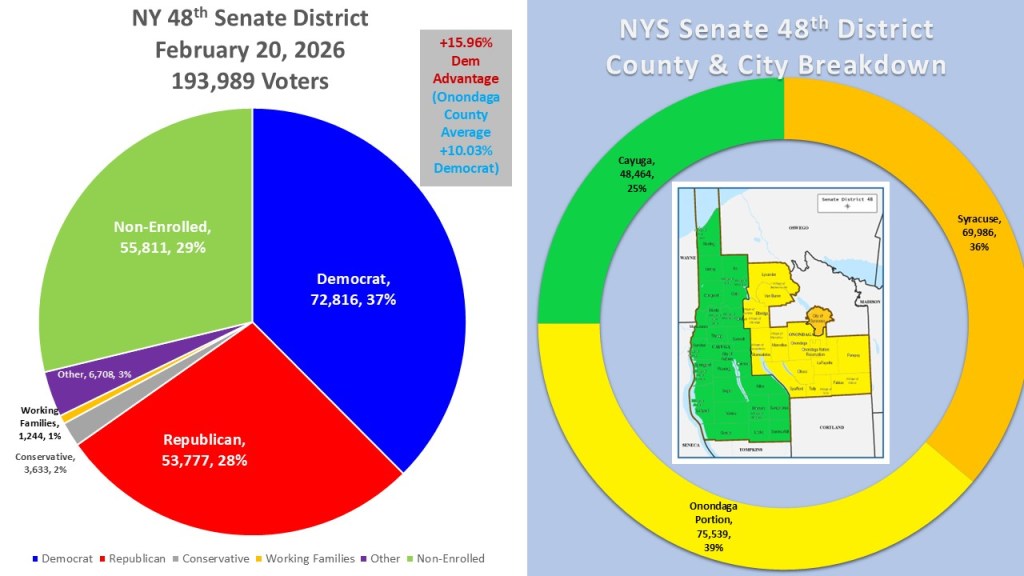
The current makeup of NY 48th has 193,989 active registered voters as of February 20, 2026. 72,816 (37%) are Democrat and represent the plurality. In a telltale sign of a Democratic dominated district the non-enrolled are in second place with 55,811 (29%) voters. The Republicans are in third place with 53,777 (28%) voters. Rounding out the district are Other (6,708 3%), Conservative (3,633 2%) and Working families (1,244 1%). The district consists of three distinct sections. The City of Syracuse has 36% (69,986 voters) of the district. The south and west portions of Onondaga County make up the largest portion at 39% (75,539 voters). The entirety of Cayuga County is in the district and makes up just 25% (48,464 voters) of the district.
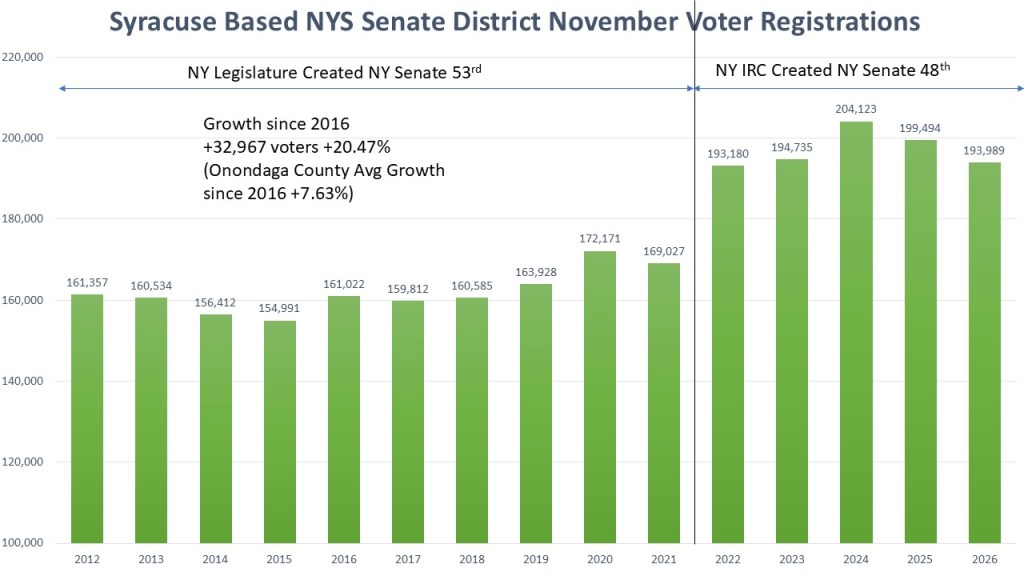
Like other districts in New York that we will examine, redistricting has played a significant role in shaping this district over the past decade. The district in Syracuse underwent significant changes because of the 2022 redistricting process. Under previous versions the district spread north and east from Syracuse into Oneida and Madison County. However, the so call NY “Independent” redistricting Commission flipped the Onondaga County Based districts, and the Syracuse based one went South and west through Onondaga County and have all of Cayuga County. Though perhaps the biggest change was the number of voters in the district. A new redistricting law mandated equal districts throughout New York State, ending the practice NY Republicans used to keep their shrinking majority bey having upstate districts have fewer voters in it. We see that in the big jump in population after redistricting. This is why the district has added 32,967 voters since 2016, a growth of 20.47% way larger than the Onondaga County average of +7.63%.
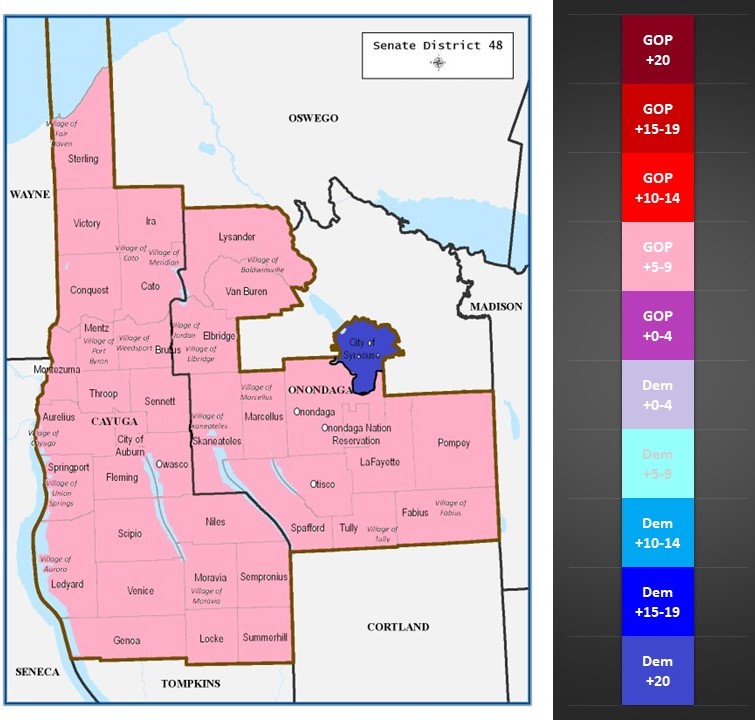
The three portions of the 48th district show one of the major dynamics of the district. We see the highly dense City of Syracuse with an overwhelming Democratic lean of over +20%. The rest of the district does lean GOP, but not overwhelmingly so. The remaining Onondaga County portion is in the GOP +5-9% category. The same with Cayuga County which is also in the GOP +5-9% category. While there are towns better than others and the City of Auburn slightly tilts blue on its own, the story of this district is clear. Can the City of Syracuse continue to exert dominance over the rest of the district?
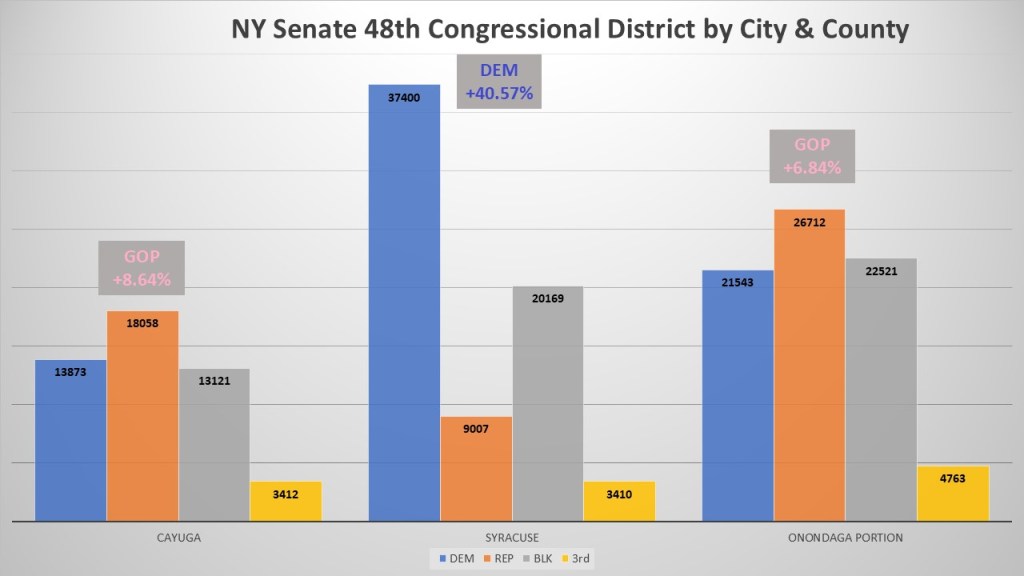
The voter breakdown of the city and county portion also buttresses that story. Democrats dominate the City of Syracuse at +40357% but the non-enrolled are also more than double the GOP. The rest of the Onondaga County portion we see the Gop have a plurality at +5.84% and the non-enrolled slightly outnumber the Democrats. Cayuga County is in between the two, Republicans have a higher percentage advantage at +8.64% but Democrats, barely, outnumber the non-enrolled.
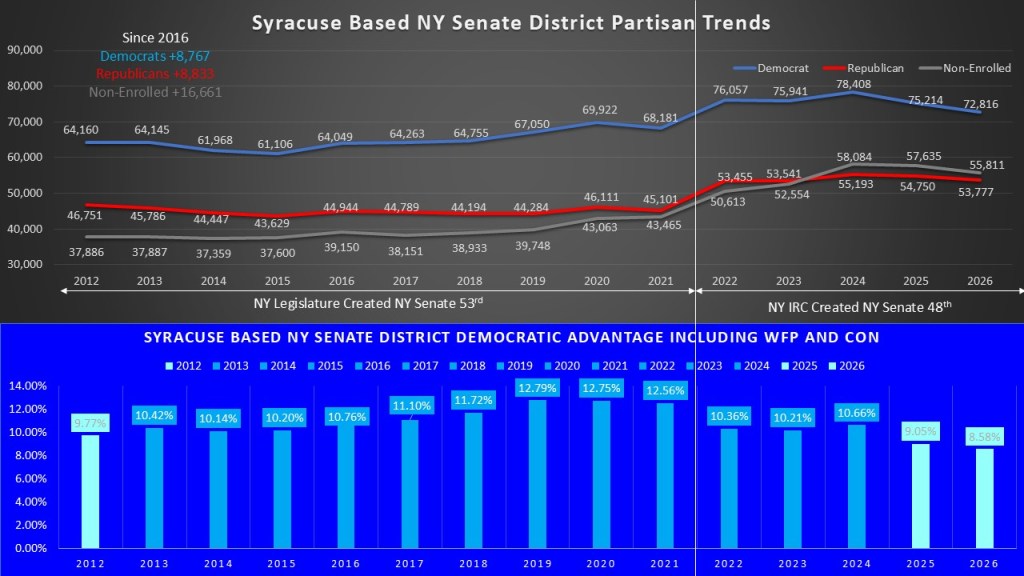
When we look at the partisan trends of the district, we really see the effect redistricting has on the district. Despite a big swing in geography, the district is near the same in makeup. But there are slight differences. Since 2016 Democrats have added 8,767 voters and Republicans have added 8,833 voters. This was mostly after redistricting in 2022. However, the non-enrolled is the big gainer, almost equaling both parties together at +16,661 voters. In fact, the non-enrolled, due to the influence of Syracuse, grew more than the GOP in 2024. When we add in the conservatives and Wp to see the ideological bend of the district, we see there was a drop after redistricting, and a small regression since 20224. However, that is because urban areas tend to fluctuate the most between Presidential elections. Still the non-enrolled are the key to this district now more than ever.
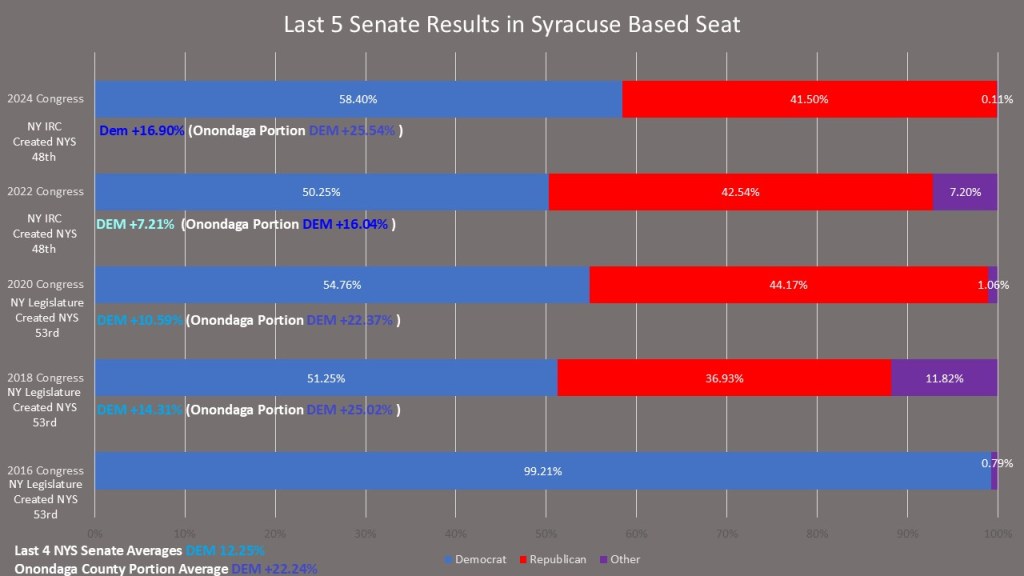
Finally, without the ability to get comparison races that span the entire district because of the radical redistricting in 2021 we are going to look at the last five elections. In 2016 Dave Valesky because of his connections to the IDC and NY GOP caucus had his third straight non-contested election. In 2018 Rachel May beat Dave Valesky in the primary but Valesky remained on the ballot because NY laws about third parties not allowing him to drop off. She easily won election by 14.31%. In 2020 Rachel May won re-election by 10.59%. The closest election was the year after redistricting. One of the worst years for Democrats and a brand-new district had Rachel May only win by 7.21%. Although she was already likely to win a tight race, a third-party conservative candidate also helped her secure victory. In 2024 though Rachel May bounced back with her biggest win at +16.90% after the newer part of her district got to know her during the last ter. It is the Onondaga County portion of the district that consistently votes for May. Rachel May has won her last four elections by +12.25%, but won the Onondaga County portion of the district, including Syracuse by an average of +22.24%.
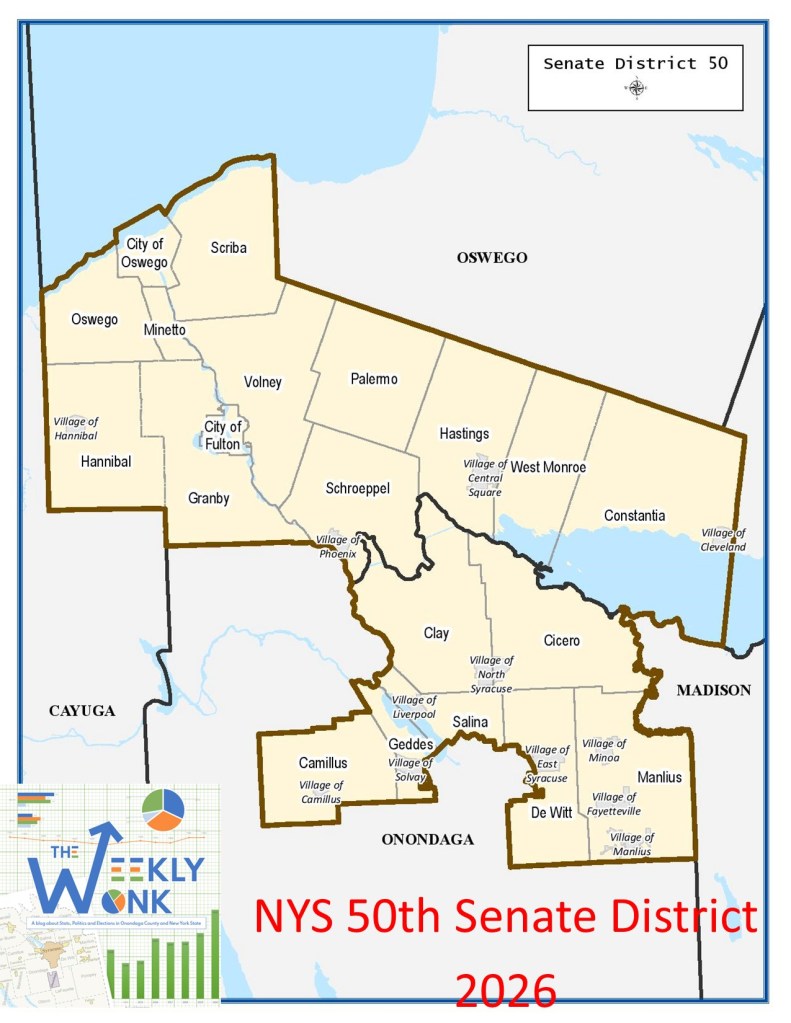
That is, it is for this week’s edition of the #weeklywonk. Next week I set my sites on the other Senate District in Onondaga County, the suburban based NY Senate District 50. This district fell into Democratic hands in 2020 after generations in Gop hands. We will look at the data as Senator Chris Ryan runs for re-election this year. As always, you can subscribe to Dustinczarny.com to get content and election news updates.
The Weekly Wonk: New York’s 22nd Congressional District 2026
Welcome back to #WeeklyWonk, my weekly column examining political data published on dustinczarny.com. Each week, I explore a political subdivision or election event in Central New York or across New York State, using voter registration data and election results to tell a broader story about our political landscape. This week, I turn to the race likely to generate the most attention in our region: New York’s 22nd Congressional District. In 2024, John Mannion flipped this district from red to blue after a decade of Republican control. If he wins reelection it will be the first time a Democratic Congressperson has won reelection since 1980. As he prepares to take a run at history, it’s worth taking a closer look at how the district is currently structured and what the numbers tell us.
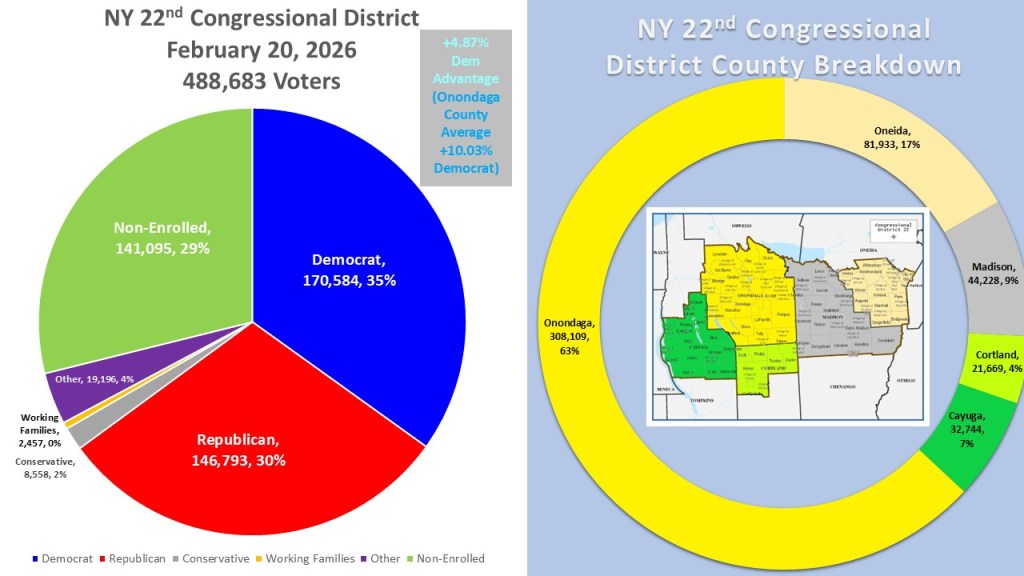
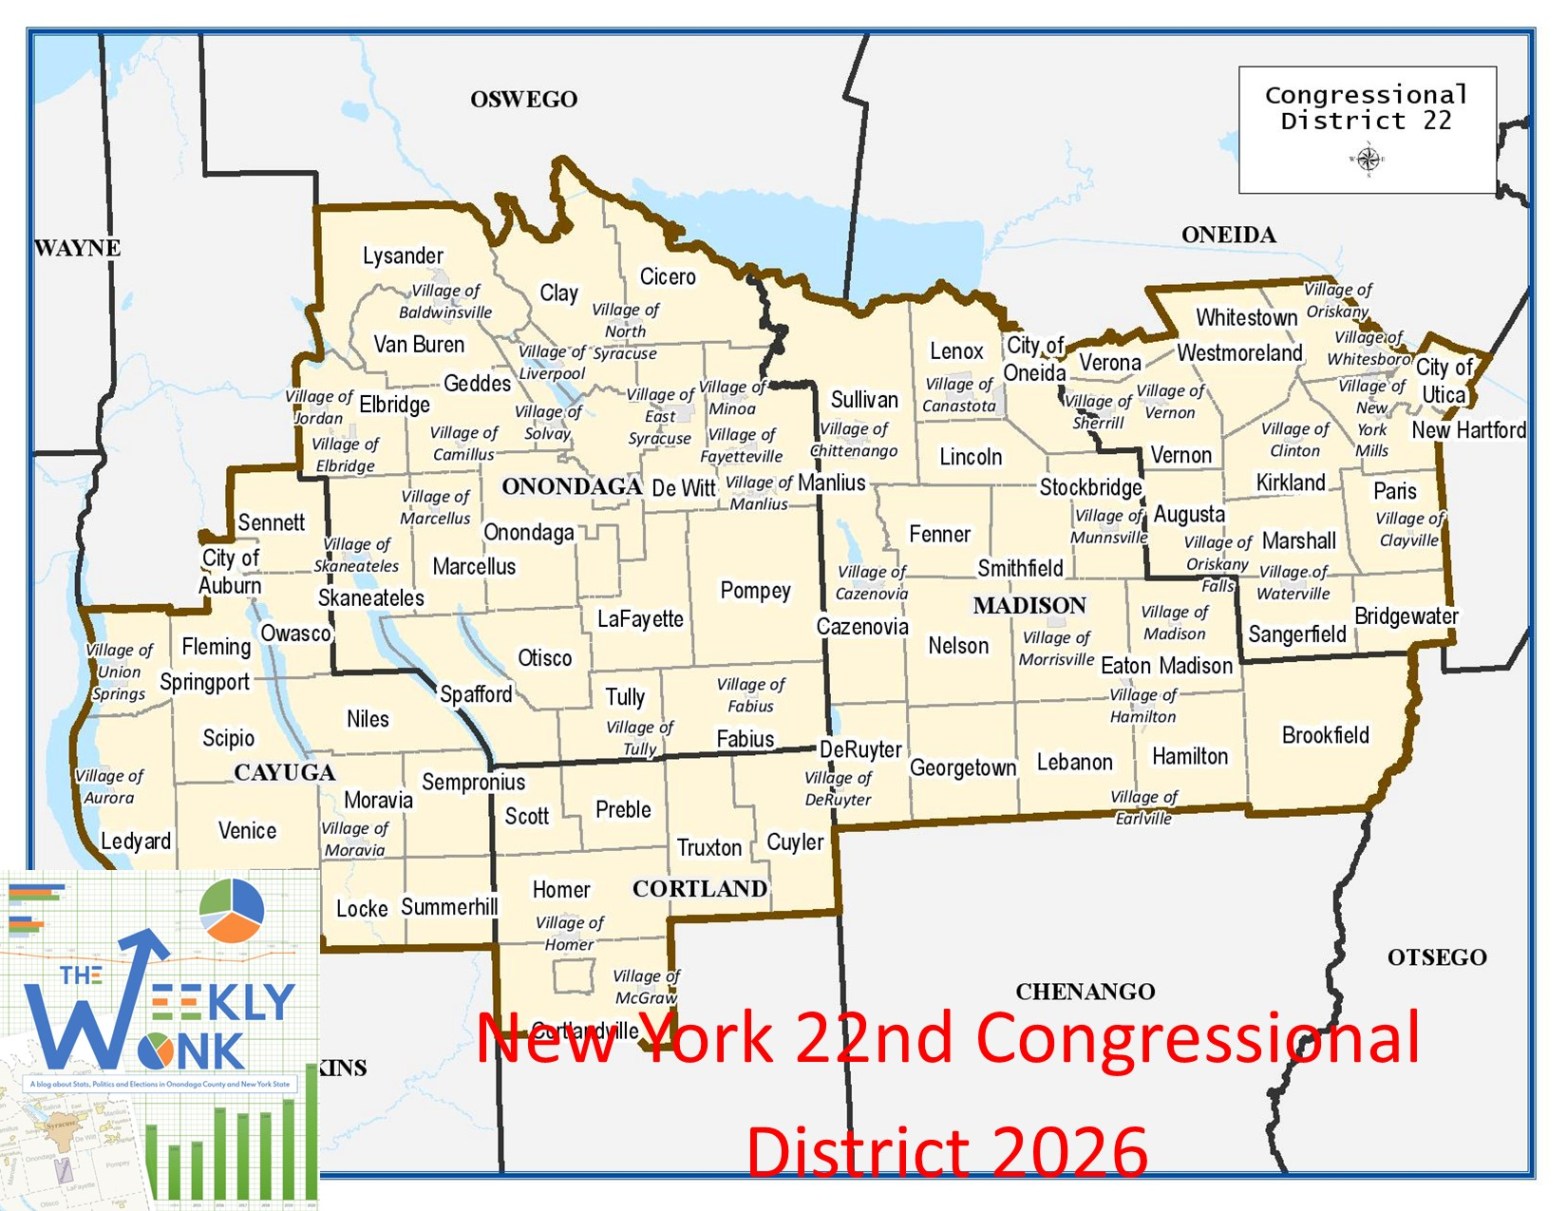
According to data from the New York State Board of Elections as of February 20, 2026, NY-22 has 488,683 registered voters. Democrats hold a plurality with 170,584 voters (35%). Republicans follow with 146,793 (30%), and non-enrolled voters are close behind at 141,095 (29%). Smaller parties make up the remainder: Other (19,196; 4%), Conservative (8,558; 2%), and Working Families (2,457; less than 1%). Geographically, NY-22 spans five counties: all of Onondaga and Madison counties, along with parts of Oneida, Cortland, and Cayuga. Onondaga County overwhelmingly dominates the district, accounting for 73% (308,109) of all voters. The Oneida portion contributes 17% (81,933), Madison 8% (44,228), Cayuga 7% (32,744), and Cortland 4% (21,669).
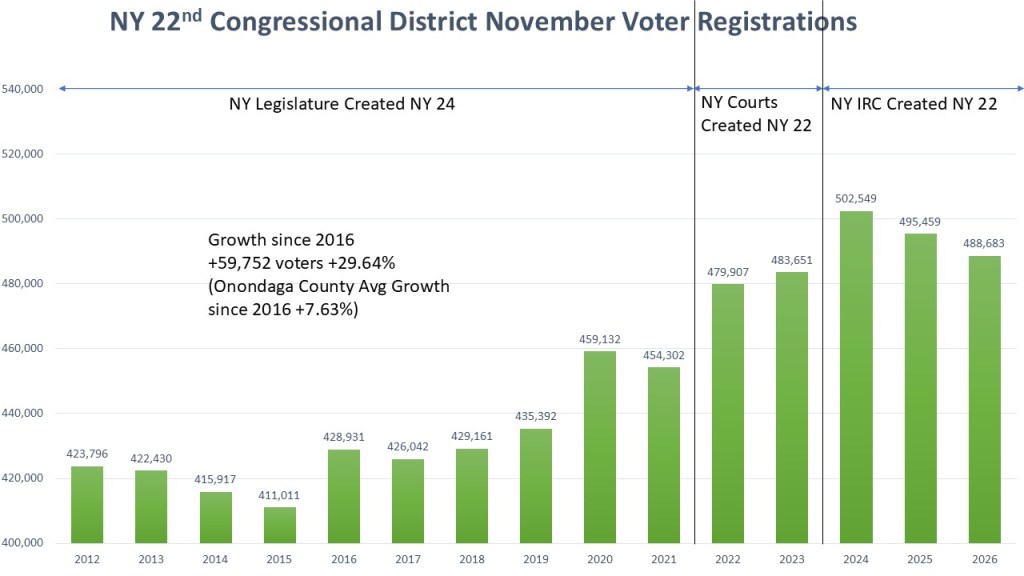
Any discussion of NY-22 must include redistricting. The Onondaga-based district has undergone three major configurations in recent years. The former NY-24 was created through a bipartisan legislative agreement in 2012. The contentious nature of that process led to the establishment of the New York Independent Redistricting Commission (IRC). However, in 2022, the IRC failed to produce a consensus map due to partisan divisions. The New York Supreme Court ultimately drew interim districts, and the Court of Appeals later directed the IRC to complete its work in time for the 2024 elections. Since 2016, the district has grown significantly, adding 59,752 voters—a 29.64% increase—due in part to redistricting changes and expanded voter registration access. By comparison, Onondaga County alone grew by just 7.63% during the same period.
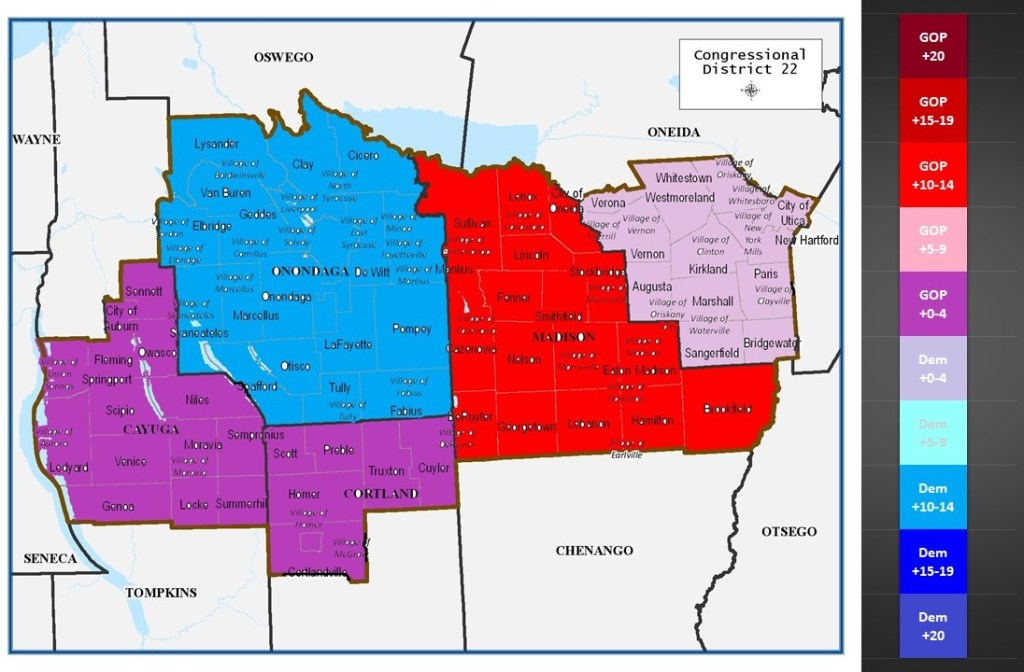
A geographic and partisan “heat map” of the district highlights its diversity. Onondaga County leans solidly Democratic by about 10–14%, while Madison County leans strongly Republican by a similar margin. The remaining counties are more competitive: the Cayuga and Cortland portions fall in the GOP +0–4% range, while the Oneida portion (including Utica) sits in the Democratic +0–4% range.
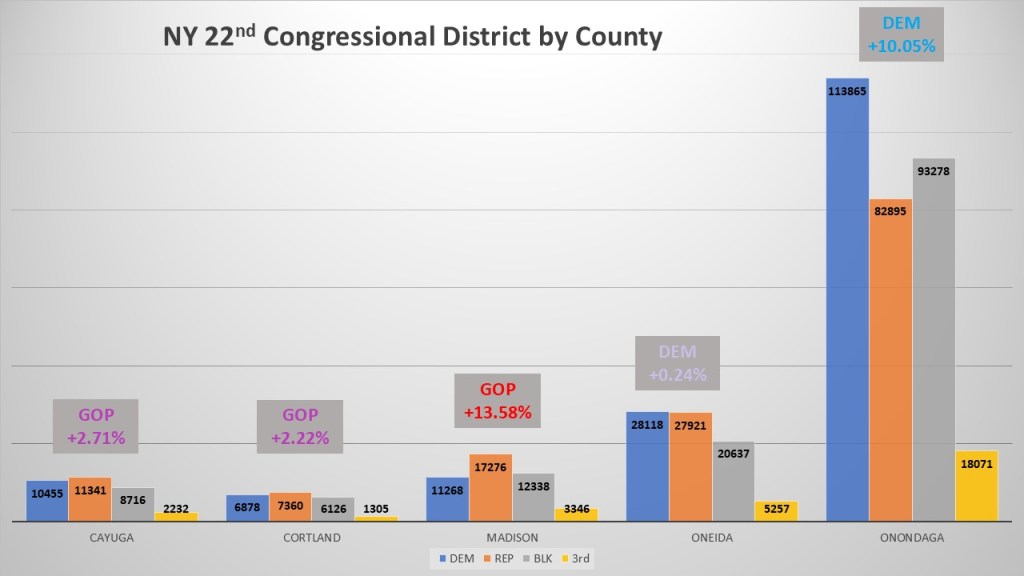
Looking at the county breakdown underscores just how dominant Onondaga County is. It contains more voters in each major category—Democrat, Republican, and non-enrolled—than any of the other counties individually. The smaller counties are relatively balanced and therefore exert limited influence on the overall partisan makeup. While Madison County shows a strong Republican lean (+13.58%), its size is not large enough to offset Onondaga’s Democratic advantage (+10.05%), which ultimately drives the district’s overall partisan tilt.
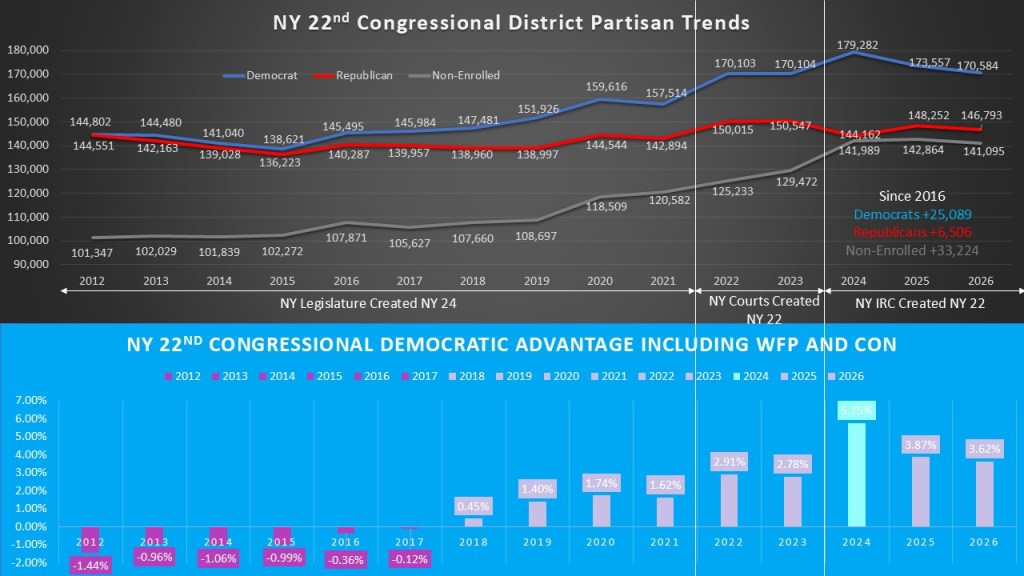
Over time, the Onondaga-based district has shown a clear trend toward Democrats. This shift began under the old NY-24 boundaries and continued through subsequent redistricting cycles. While the 2022 court-drawn map slightly favored Democrats, the 2024 IRC map provided the most advantageous configuration yet. Since 2016, Democratic registration has grown by 25,089 voters, compared to a Republican increase of 6,506. The largest growth, however, has been among non-enrolled voters, which increased by 33,224. Despite these gains, the district’s overall partisan lean has shifted more modestly. In 2021, Democrats (including Working Families and Conservative cross-endorsements) held a +1.62% advantage. By 2024, that margin had increased to +5.75%.
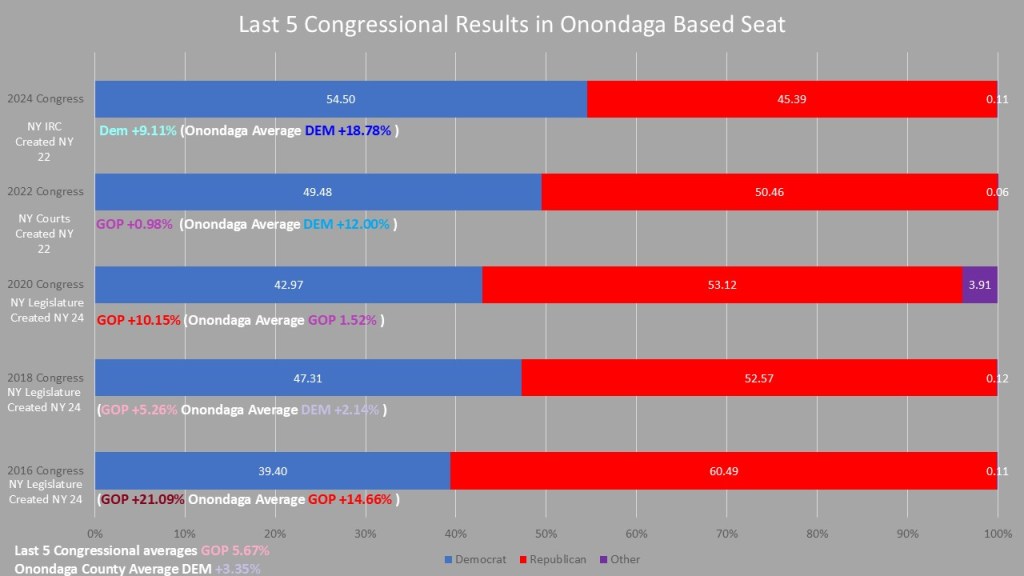
While I don’t currently have the tools to fully analyze comparable past races across changing district lines, we can still draw meaningful insights from recent elections—particularly within Onondaga County. Mannion’s decisive +9.11% victory in 2024 cannot be explained solely by the district’s modest Democratic lean. Instead, the key lies in Onondaga County’s performance. In 2018, Dana Balter won Onondaga County, and in 2020 she likely would have done so again if not for a split Working Families Party line caused by a paperwork issue. In 2022, Democrat Conole carried Onondaga by +12.00%, and in 2024, Mannion expanded that margin to an overwhelming +18.78%. Given Onondaga County’s size and influence, this trend has been central to the district’s Democratic resurgence.
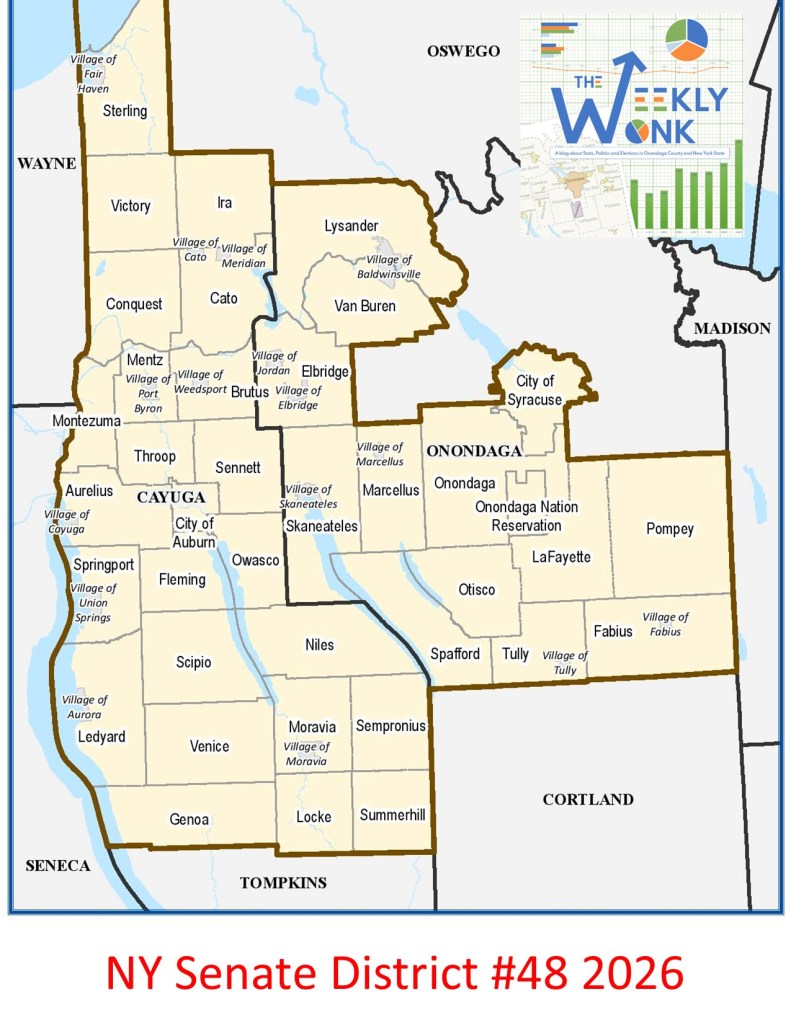
That’s it for this week’s #WeeklyWonk. Next week, I’ll continue my nine-part series on New York State offices, beginning with State Senate District 48, which includes parts of Syracuse and extends west into Cayuga County. As always, you can subscribe at dustinczarny.com for more updates and analysis.
Interview: Democratic Onondaga County Elections Commissioner Dustin Czarny -Newschannel 9
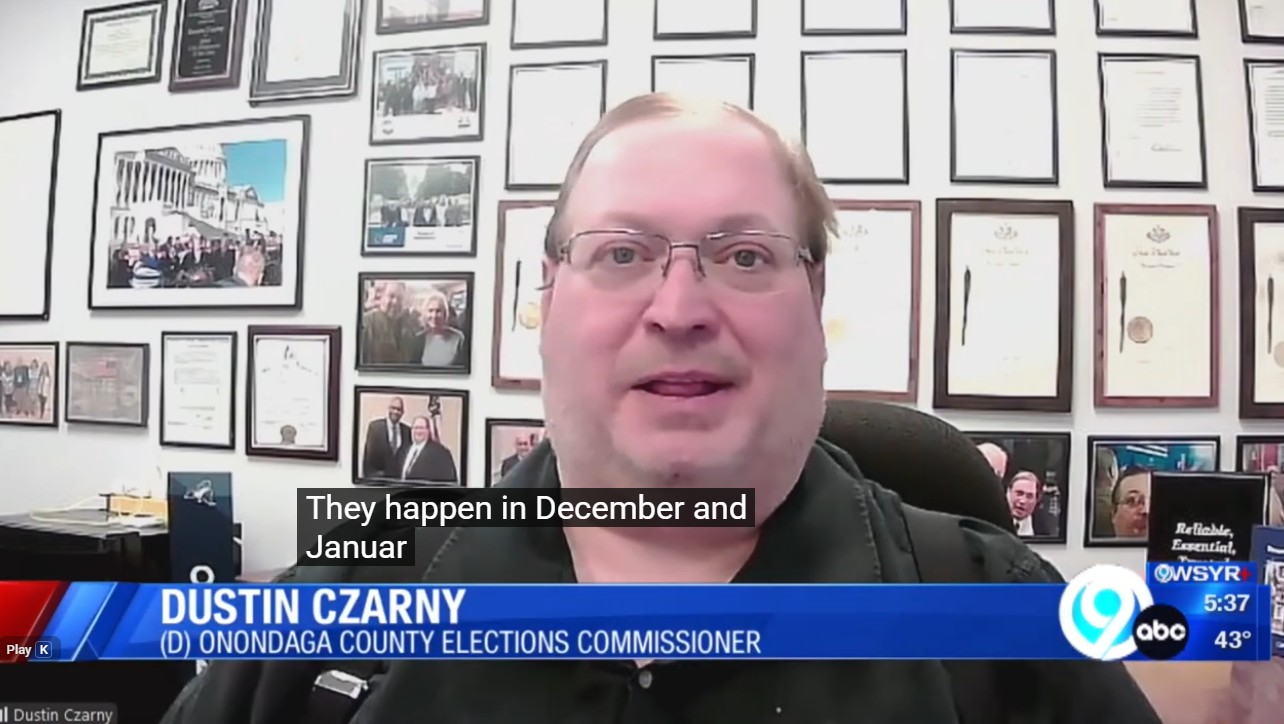
I talked to NewsChannel 9 about the recent village elections, the turnout, and the benefits of moving to November.
Subscribe to dustinczarny.com for all news and content updates
NY Elections, Census, and Redistricting Update 3/24/26 – NY Law School City Land
“According to Dustin Czarny, the Democratic elections commissioner of Onondaga County, under this bill, voters would need to provide a passport or birth certificate when registering and at the polls because New York driver’s licenses do not attest to citizenship on their face.”
Subscribe to dustinczarny.com for all content and election news updates
The Weekly Wonk: New York’s 5th Judicial District 2026
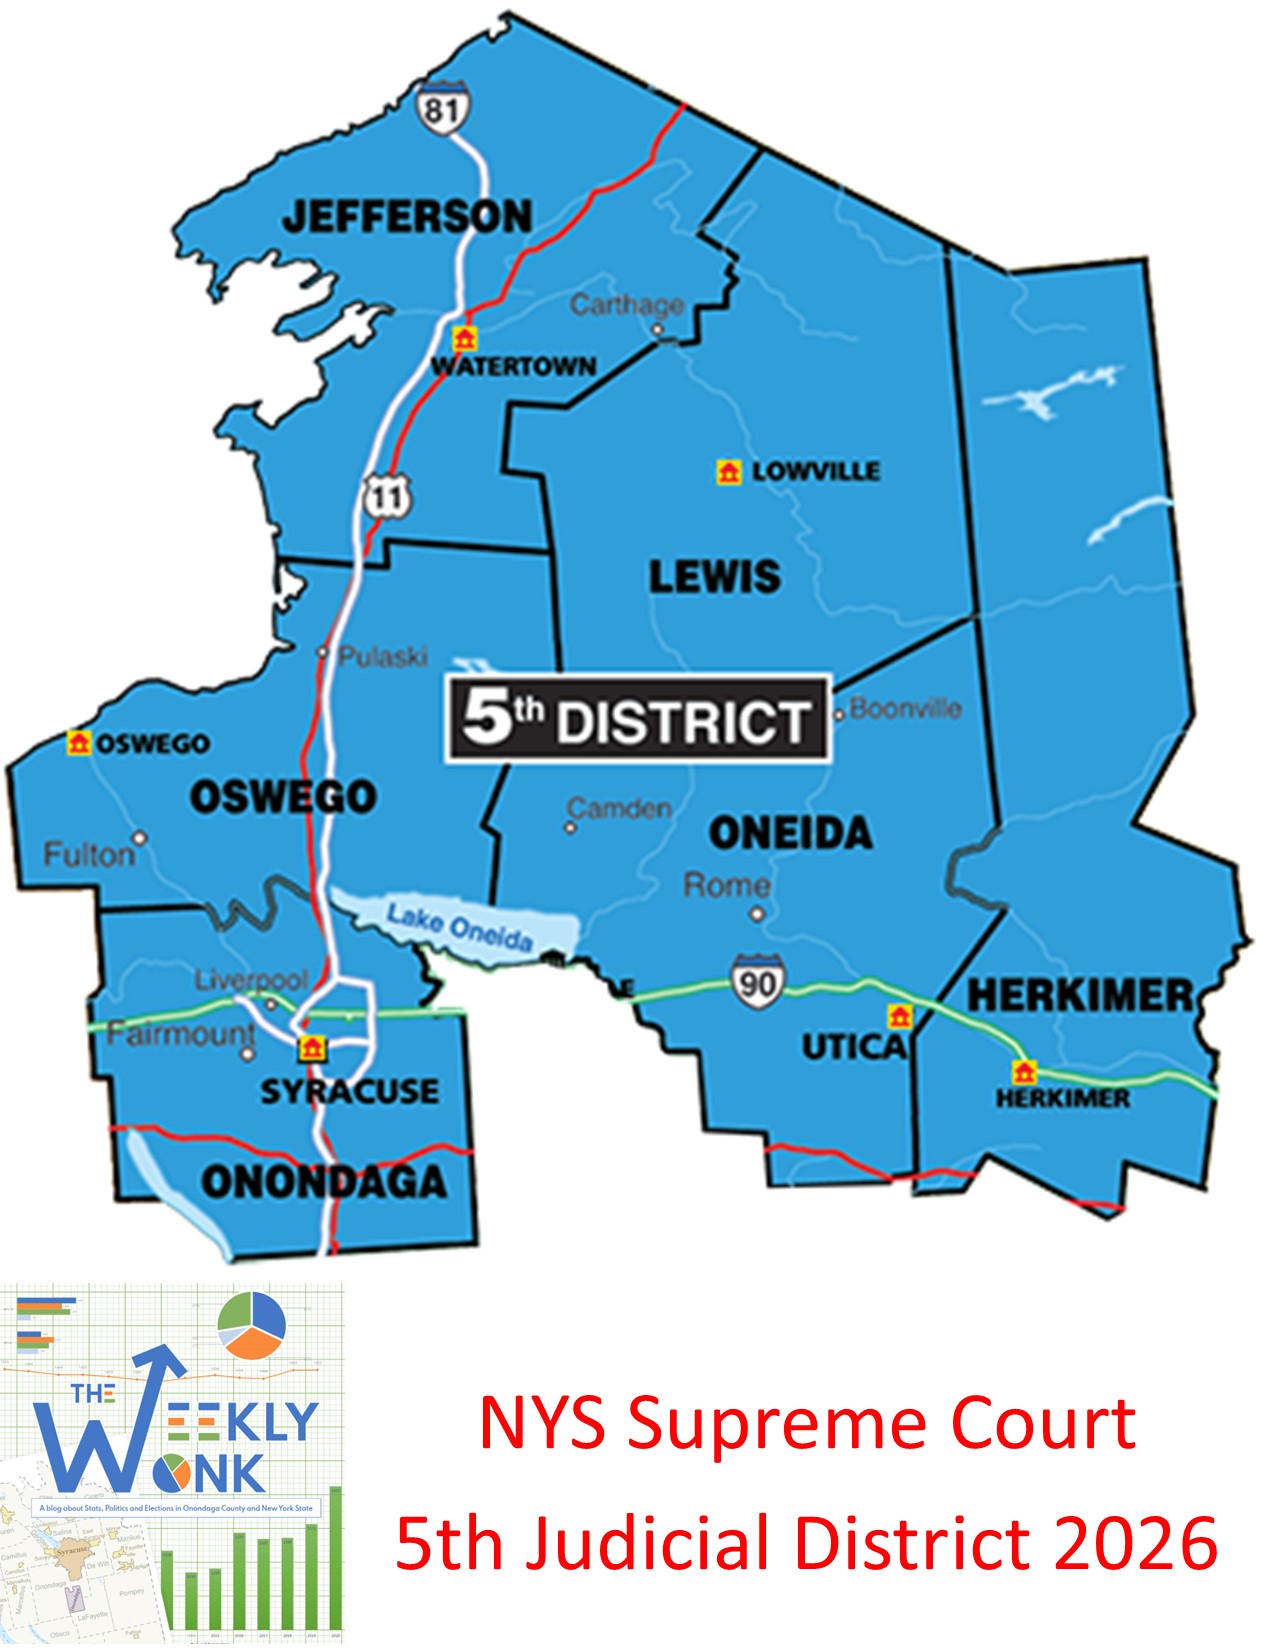
Welcome back to the #weeklywonk. This is my weekly article on dustinczarny.com about statistics and data. Each week I dive into the electoral and registration data on a political subdivision or election relevant to 2026. Currently I am in the middle of diving into the New York Stat races appearing on the Onondaga County Ballot this year. This week I am diving into part two of this nine-part series, the NYS Supreme Court race in the fifth judicial district.
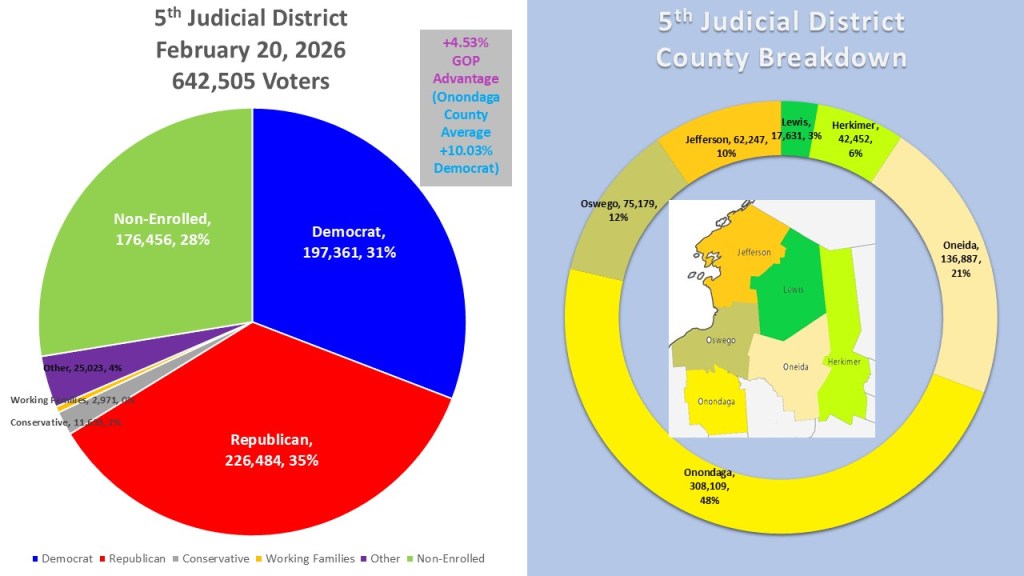
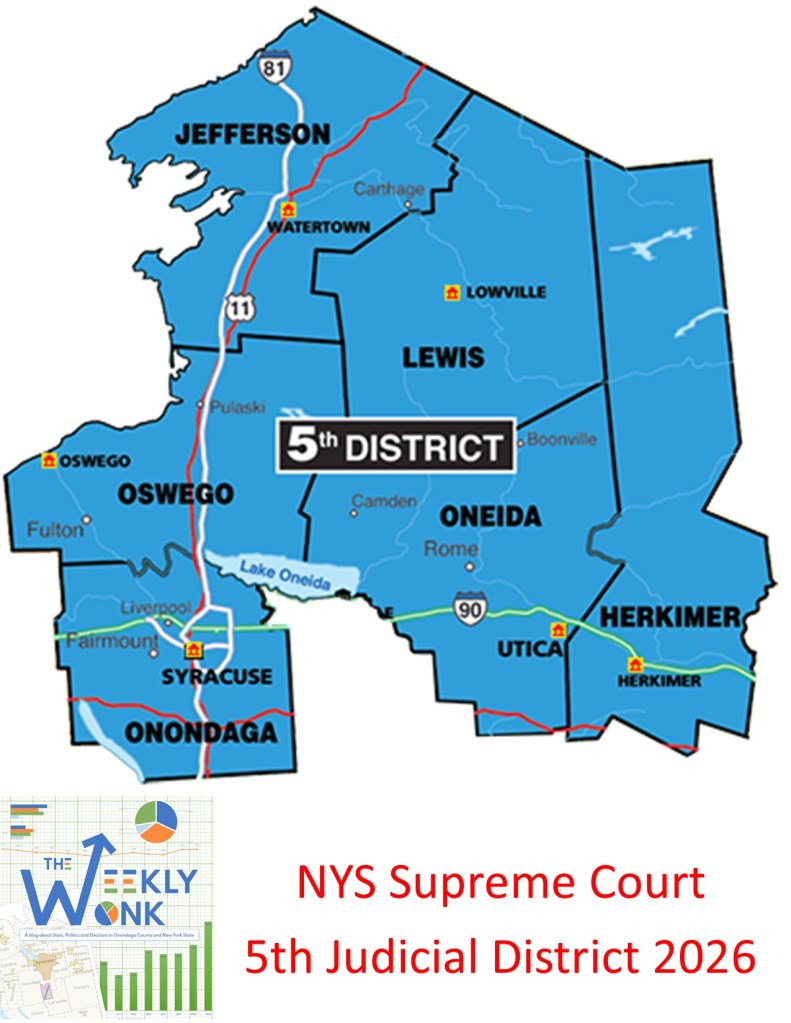
We select our Supreme court seats in New York (which is the lowest court level) in judicial districts. These massive districts are the largest political subdivisions in New York State. The 5th Judicial district spans six counties, Herkimer, Jeffereson, Lewis, Oneida, Onondaga, and Oswego County. According to the NYS Board of Elections February 20, 2026, enrollment reports it has 642,505 voters. Republicans own the plurality of it with 226,484 voters (35%). Democrats come in second with 197,361 voters (31%), and non-enrolled third with 176,456 voters (28%). Other (25,023 4%), Conservative (11,633 2%) and Working families (2,9721 <1%) round out the enrolled active voters. Onondaga County is the largest plurality of the district with 48% (3098,109) of the voters. Oneida is the second most populace county with 215 (136,887) of the voters. Oswego (75,179, 12%), Jefferson (62,247%), Herkimer (42,452 6%), and Lewis (17,631 3%) make up the rest of the district.
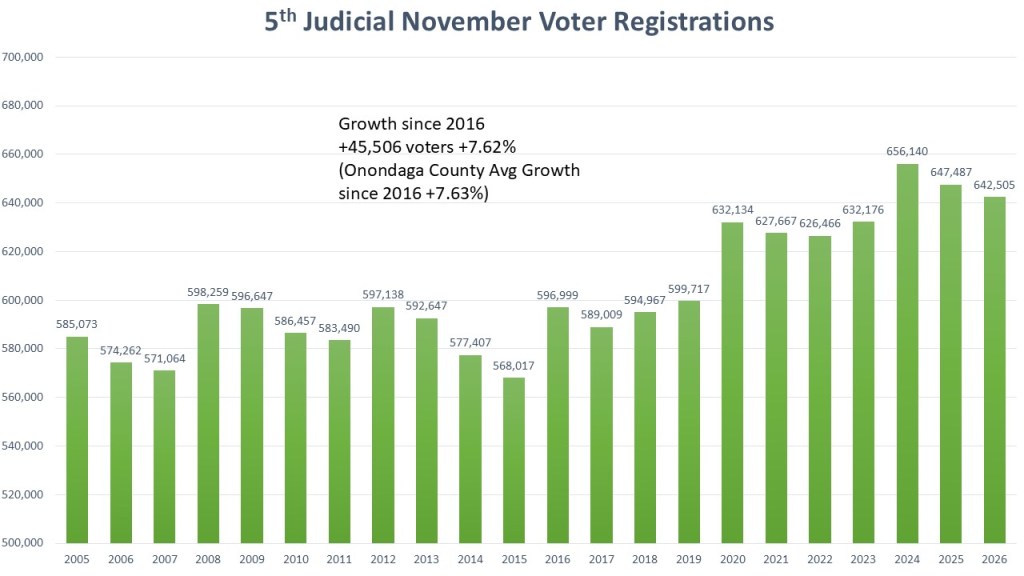
The 5th Judicial district is behaving the way New York State has in terms of adding voters. Some growth started with the 2016 election and online voter registration with the DMV. The largest growth of voters has happened since 2020 thanks to the reforms put in place by the Democratic controlled legislature to make it easier to register to vote and stay registered to vote in New York. Since 206 the 5th Judicial district has added 45,506 voters which is a growth rate of 7.62%. This nearly mirrors the growth rate of Onondaga County which is the largest county and has an enormous impact on the district.
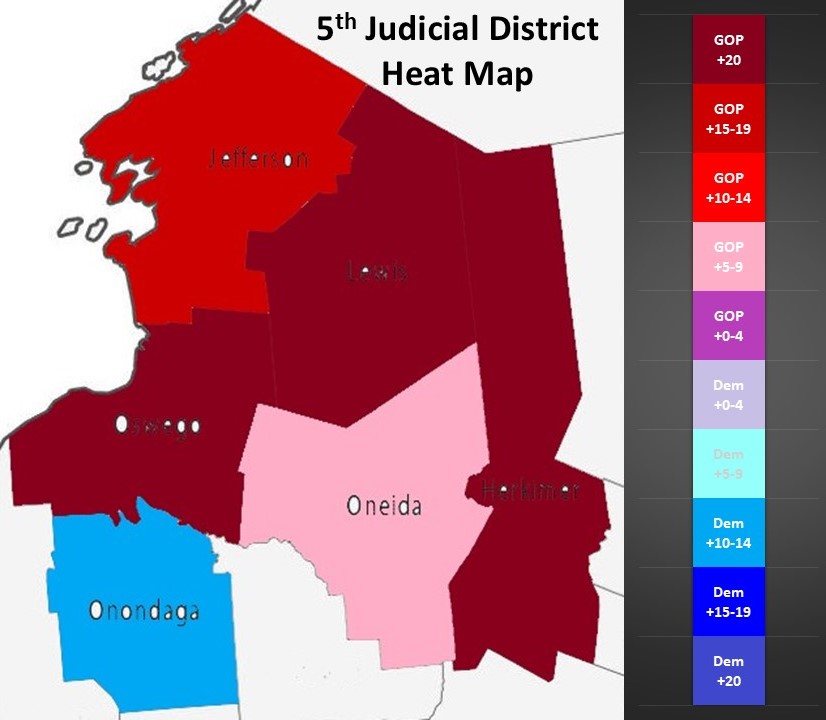
Here in this heat map of the 5th Judicial district, we really see how this district becomes so balanced. Onondaga County acts like a blue anchor on the district in the moderate Democrat lean category of 10-14%. Oneida has a slight GOP lean of 5-9% Jefferson is a strong GOP lean in the 15-19% category. Herkimer, Lewis, and Oswego are in the Overwhelming GOP lean category of +20%.
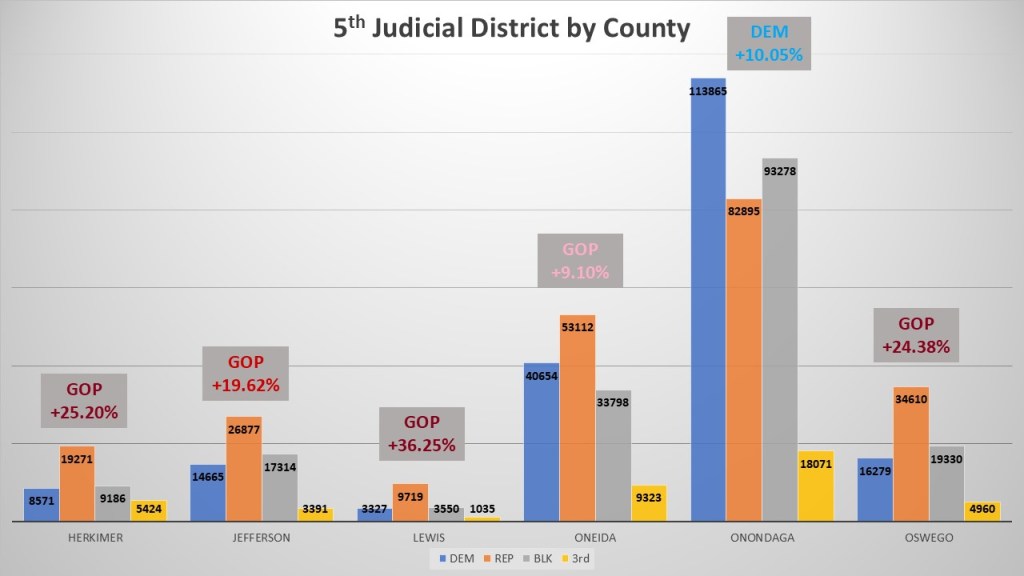
In the county break down we truly see how Onondaga County balances the district and gives Democrats a fighting chance All four of the small GOP counties we see the signs of GOP dominance with non-enrolled outnumbering the Democrats and overwhelming GOP enrollment advantage (Lewis +36.25% GOP, Herkimer +25.20$+% GOP, Oswego +24.38% GOP, Jefferson +19.62% GOP). Oneida represents a more typical GOP county with a 9.10% GOP advantage and Democrats in second. Onondaga is a strong blue county with a +10.05% DEM advantage and non-enrolled outnumbering the GOP.
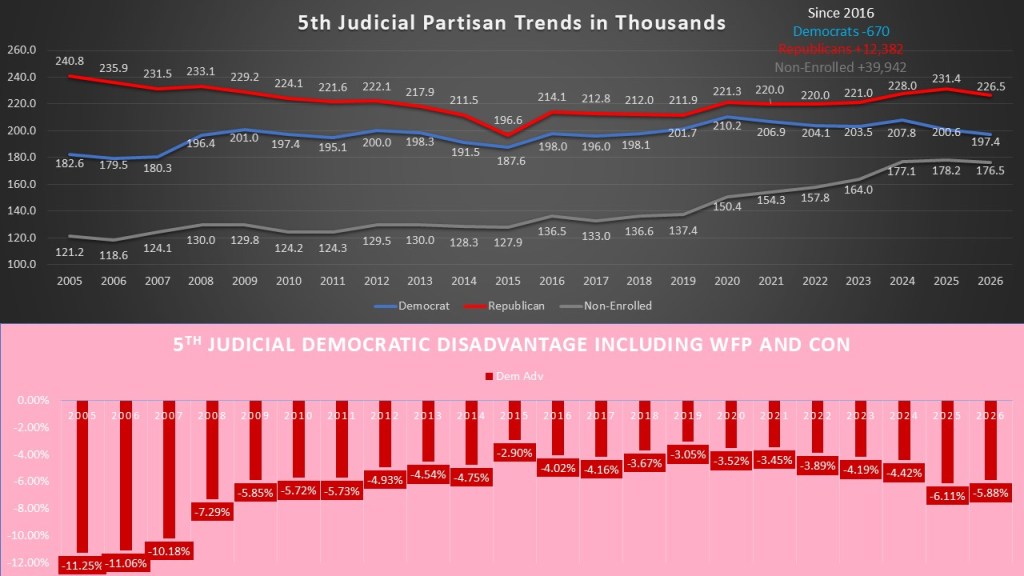
When we look at the partisan trends of the 5th Judicial district we see a unique trend. Up until 2015 Democrats were closing the gap with the GOP, mostly through the GOP losing voters more than Democrats gaining. However, once Trump entered the political lexicon in 2016, we saw republicans, led by the 5 GOP counties, had a resurgence over the last ten years as Democrats have remained stagnate. Democrats have lost 670 voters over the last ten years as while the GOP has added 12,382 voters. However, the non-enrolled is still the highest grossing by far adding 39,942 voters. When looking at the effect of conservative and WFP voters we really see the closest this district came to ideological balance was 2015 when the right (republicans and Conservatives) had a just a +2.90% In fact 2025 was the highest ideological advantage for the right with +6.11% but it also corresponds to the largest defeat when Democrats won 3 of 4 Supreme Court seats.
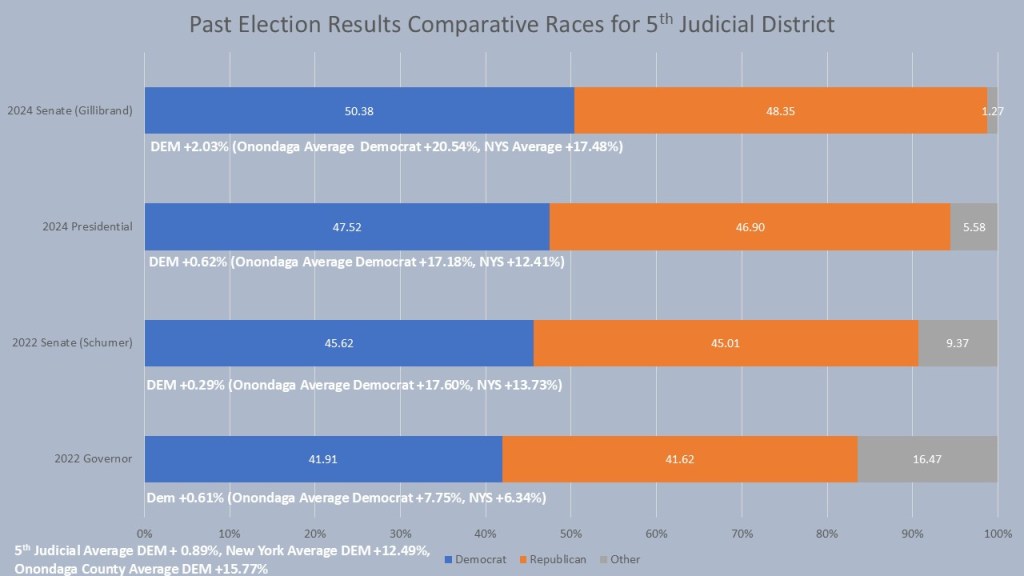
We can ee that despite the ideological balance of the district shifting to the right, in federal years Democrats have performed well overcoming their disadvantage. In fact, they have one plurality in all four of our comparative races. In the 2024 Senate race the district performed the best for Democrats at +2.03% advantage. In the other three races they were much closer. The 2024 Presidential Race Democrats a +.62% advantage. The 2022 Senate Democrats had a +.29% advantage. The 2022 Governors’ race Democrats had +.61% advantage. This bodes well for Democrats going into 2026 which has a one Supreme Court seat on the ballot. Delegates will choose candidates during the August conventions.
That is, it is for this week’s edition of the #weeklywonk. Next week I dive into what has been the most popular race in federal elections, New York’s 22nd congressional district. After multiple close elections, it flipped in 2024 for the first time since 2014. Will Democrats be able to repeat in this district for the first time since 1980? Tune in and find out. As always you can subscribe to dustinczarny.com for all content and election news updates.
Commissioner in a Car: General Election Polling Places are Here!

On this week’s episode I talk about the release of the 2026 General Election polling place. I detail why we release them so early and what goes into choosing a polling place. I also detail the very few changes we have from last year and why changes have to be made from time to time. Enjoy.
Subscribe to dustinczarny.com for all content and election news updates.
The Weekly Wonk: New York State 2026
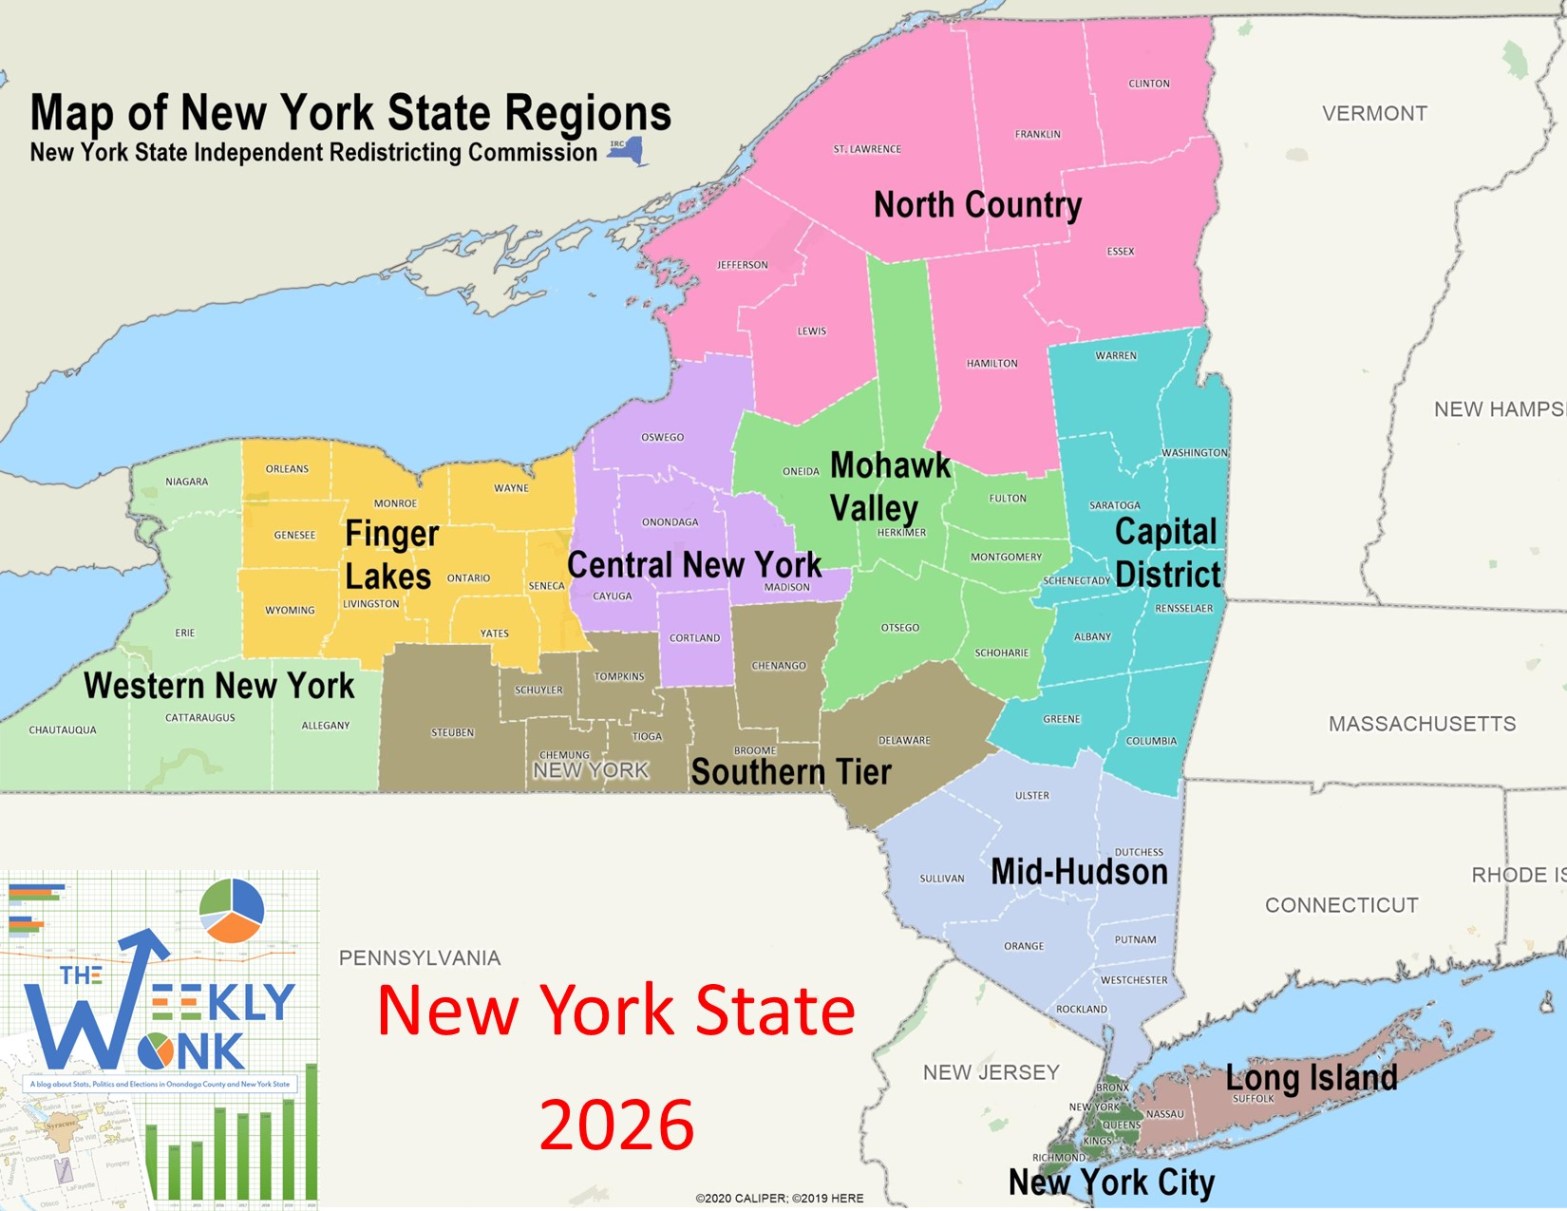
Welcome back to the #wweeklywonk. This is my weekly column on dustinczarny.com on data relevant to Onondaga County and the State of New York, each week I dive into the electoral, registration, and performance data surrounding a political subdivision or election event relevant to our home here in Central New York. 2026 is a gubernatorial year and that means we have statewide elected offices running. Today I am looking at New York State as a whole. This is the first part of my 9-part series looking at New York State offices on the ballot this year in Onondaga County. So, join me as I look at the Empire State as we head into 2026 and how it relates to Onondaga County.
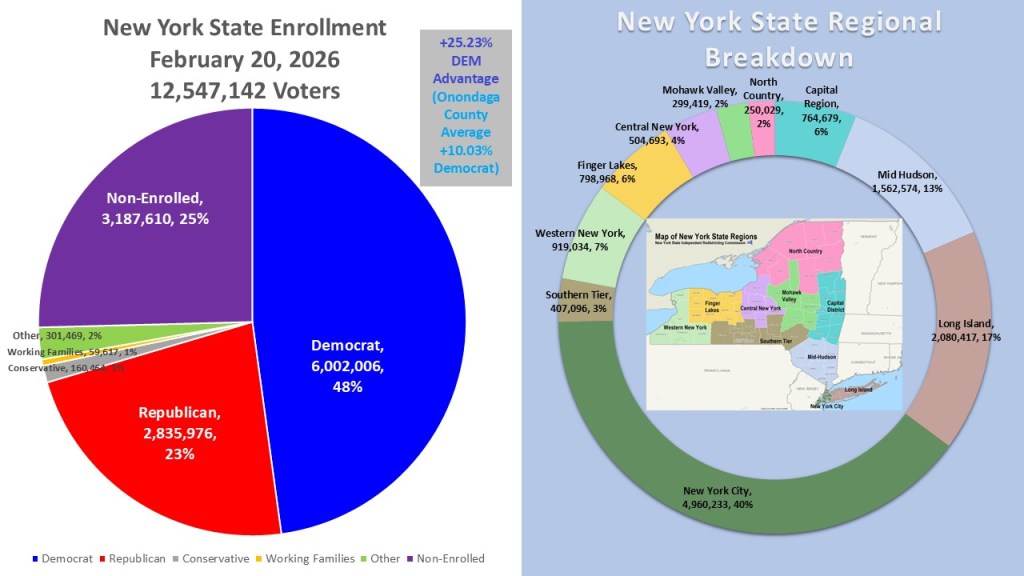
On February 20, 2026, the NYS Board of Elections pulled registration data from every County board of Elections. This gives us a good opportunity to look at how New York Stands currently with up-to-date data. As of February 20, 2026, New York has 12,547,142 active voters. Democrats are the dominant plurality of 6,002,006 voters (48%). Non-enrolled are second in New York with 3,187,610 voters (25%). Republicans have fallen to third in New York with just 2,835,976 (23%). Rounding out the population are the other category (301,469 2%), Conservative (160,464 1%), And Working Families (59,617 1%). This gives Democrats a +25.23% Democratic enrollment advantage statewide. One of the most controversial topics in New York is breaking it up into regions. To avoid this, I am using the regions as designated by the New York “Independent” redistricting commission. It is evident that New York City accounts for 40% of the state’s active voters, highlighting its dominant influence within New York. Long Island (17%) and the Mid-Hudson Valley (13%) follow this. The rest of the regions across upstate New York range from 2-7% each.
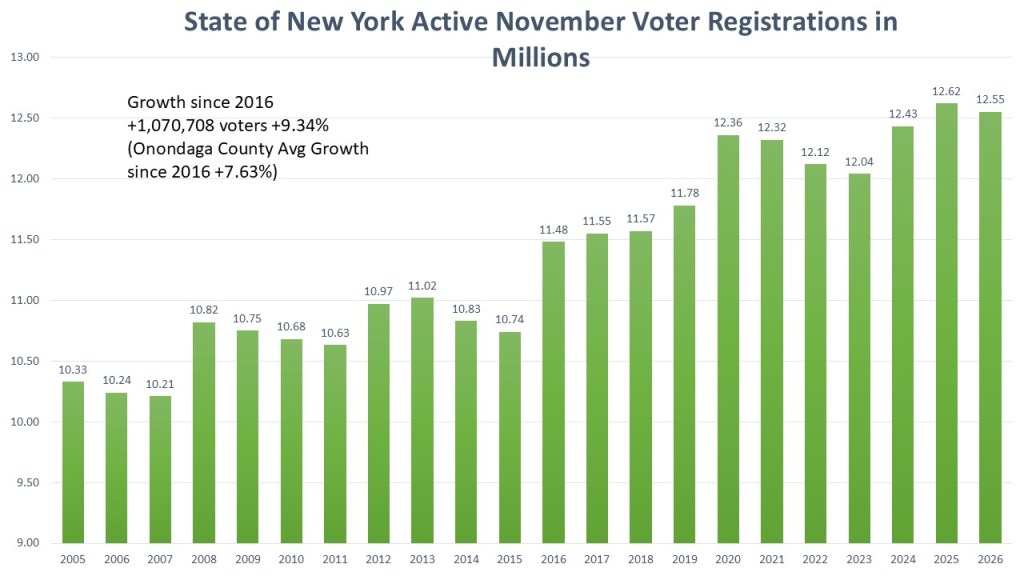
This chart shows the number of active registered voters in the State of New York in the millions. Currently New York has the second highest total of active registered voters going back to 2005. The season I cut this off in 2005 is the tracking of active and inactive voters started at that point so data before that date is not really comparing apples to apples. The changes in registration options clearly show the growth in registered voters in New York. Online voter registration began at the NYS DMV in 2016. After Democrats gained control of the NYS legislature in 2019, they passed measures like statewide transfers and a constitutional 10-day registration deadline, making it easier for voters to register and update their status. This year New York is finally launching Automatic Voter Registration with the DMV that will increase voter registration further. Since 2016 New York has added 1,070,708 voters which is a growth rate of 9.34%. Onondaga County trails the state average during that period with a growth rate of only +7.63% during this time.
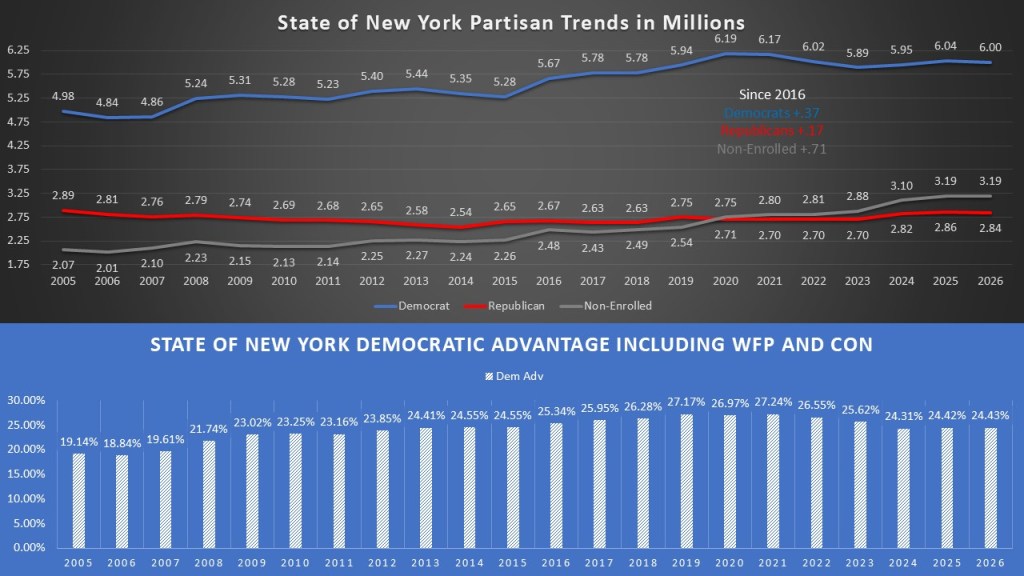
In terms of partisan trends, we see a similar trend line that we saw in Onondaga County. Democrats since 2005 have grown and Republicans have remained stagnate. The big growth category though is the non-enrolled. In 2020 the non-enrolled overtook the republican category to become second place in New York. When we dial in on the last ten years since 2016, we see this trend hold. Democrats added approximately 370k voters. Republicans have added 170k voters reversing a trend of losing voters from 2005. However, the non-enrolled grew the most again, adding over 710k voters. When we factor in the Working Families and Conservative enrollment Democrats still have a 24.43% advantage over the GOP. We do see that Democratic advantage peaked in 2021 after the end of the first Trump administration at +47.24%. There had been a steady decline until 2024. We are now starting to see another levelling off and signs of increase in the second trump term.
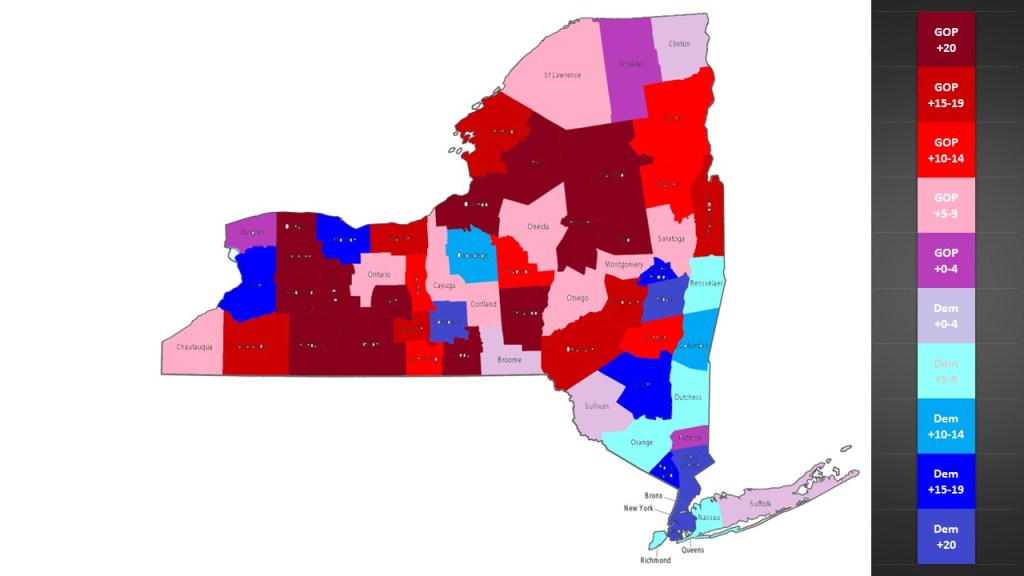
People often fail to recognize the rich diversity found throughout New York State. Here is the heat map of New York counties in terms of partisan advantage. Obviously, we see a great deal of blue in NYC and the counties downstate. But even in the upstate regions we see a great deal of counties with large clue leanings, in counties hosting large upstate cities like Buffalo (Erie), Rochester (Monroe), Syracuse (Onondaga), & Albany (Albany). Schenectady, Rensselaer, and Columbia counties make up the capital region. Tompkins County is distinctive due to Ithaca’s influence on its development. No matter what region of New York we look at there is at least one county in the region that at least is borderline Democrat with the lone exception of the Mohawk Valley.
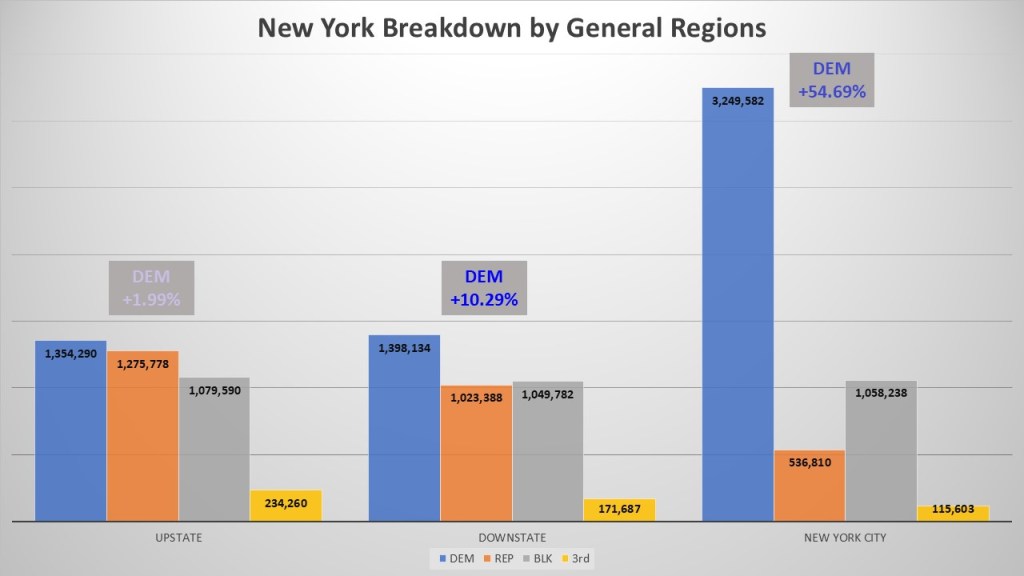
When people talk about New York State, they break it into three different macro regions: New York City, Downstate, and Upstate. For terms of this discussion, I will wade into the discussion of where upstate New York starts. Upstate New York starts Above the mid-Hudson line. I combined all regions north of mid-Hudson into the upstate region (Capital Region, Central New York, Finger Lakes, Mohawk Valley, North Country, & Western New York). Downstate are the regions directly bordering NYC (Mid-Hudson & Long Island). Democrats do well in downstate with a solid +10.29% advantage and non-enrolled are starting to overtake the GOP. Of course, in NYC the Democrats are dominant with a +54.69%. There are more Democrats alone in NYC as registered voters in the other two macro-regions individually.
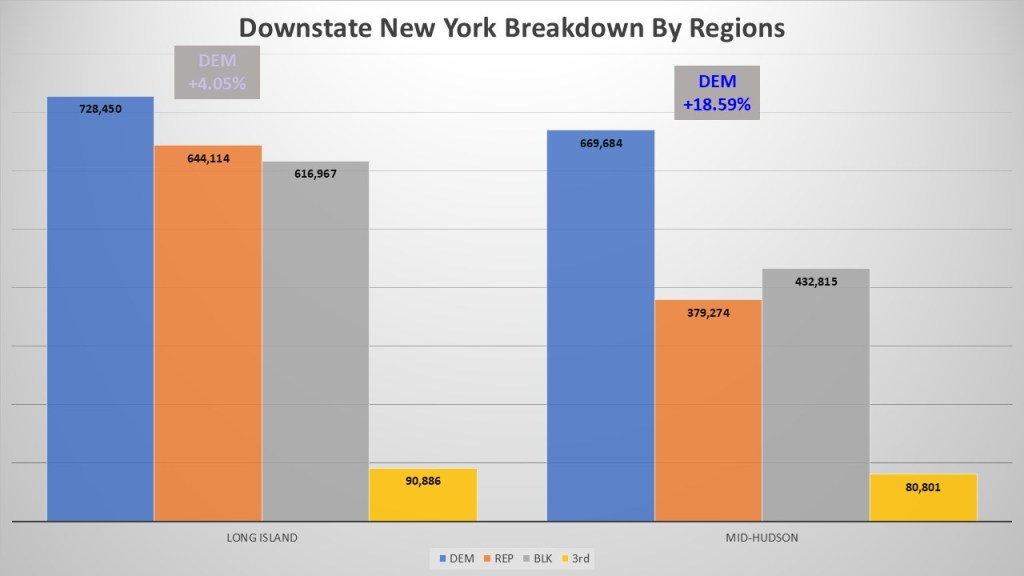
When we investigate the two regions in the downstate macro-region (mid-Hudson and Long Island) we do see a definite diversity. Long Island, which consists of Nassau and Suffolk Counties, is just barely Democratic with a margin of +4.05%. This political leaning is evident in the composition of their county governments, as well as their congressional and state representatives. Counties in the Mid-Hudson Valley, located outside New York City, show strong backing for the Democratic Party. Westchester, Ulster, and Rockland counties contribute to a notable regional shift toward the Democratic Party, reflected in a strong advantage of +18.59%. In Mid-Hudson we see the telltale sign of non-enrolled significantly outnumbering the GOP.
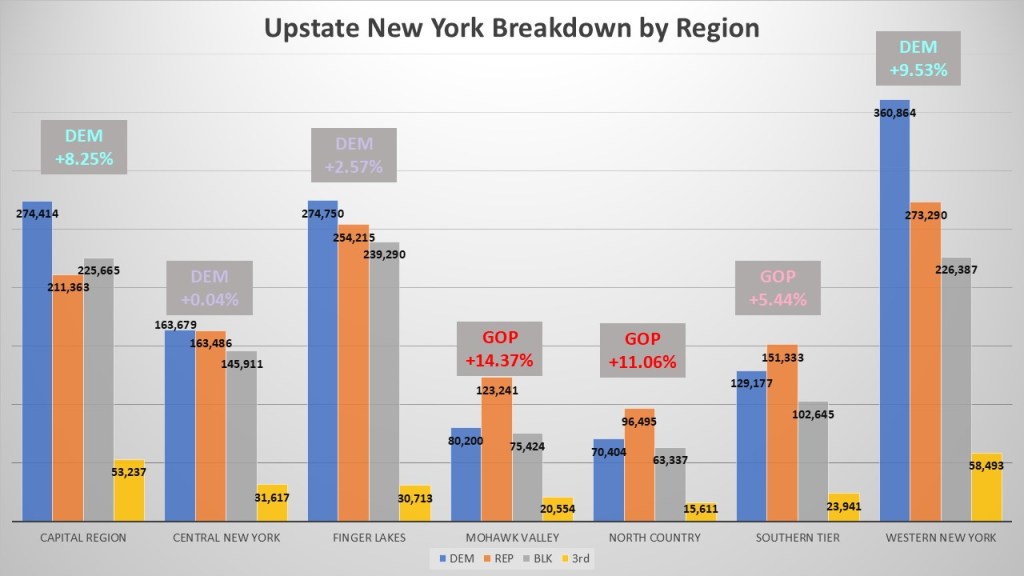
Since I defined upstate into one macro-region I wanted to show the individual regional breakdown as well. There are seven regions inside upstate, three have Democratic leans, two have GOP leans, and one, our home of Central New York, is almost dead even. Western New York is the most Democratic upstate region with +9.53%. The Capital region is second at +8.25% but is the only region where non-enrolled outnumbers the GOP. The Finger Lakes has a borderline Democratic advantage of +2.57%. Central New York is smack in the middle with less than two hundred voters separating Democrats and Republicans only a +.04% for Democrats. The GOP in the southern tier only just leans GOP +5.44% thanks to the heavy Democrat lean of Tompkins County. The North Country region is a solid republican lean (+11.06% GOP). The Mohawk valley, the only region without a blue leaning county, Has the biggest GOP advantage of +14.37%.
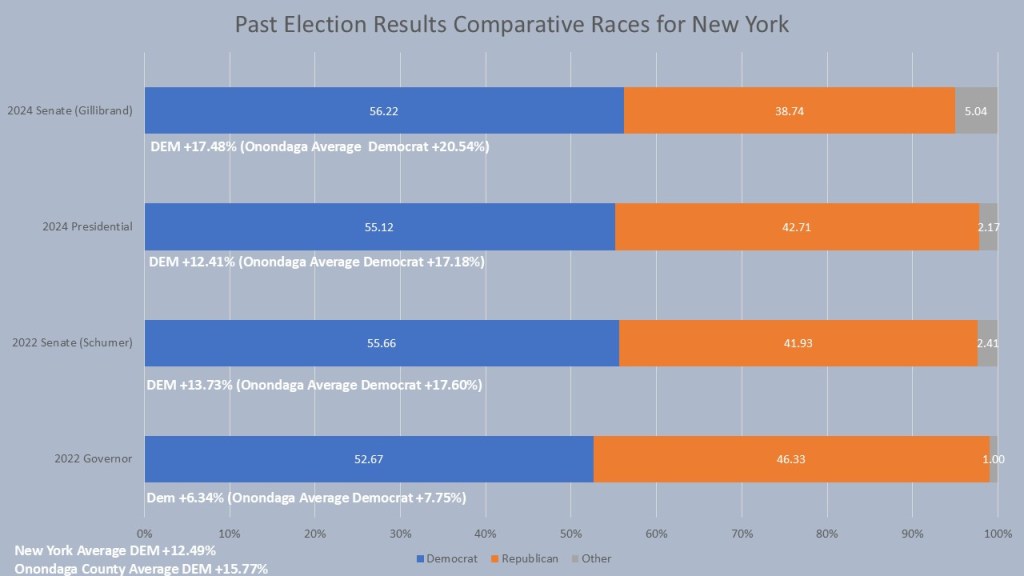
Lastly, we will look at four of the statewide races over the last two federal cycles and how Onondaga County relates to New York State as whole. In 2024 New York voted for Kristen Gillibrand for Senate by +17.48% while Onondaga County voted just to the left at +20.54%. In 2024 New York voted for Kamala Harris for President by +12.41% while Onondaga County voted more to the left at +17.18%. In 2022 New York voted for Charles Schumer for President by +13.73% while Onondaga County voted solidly to the left at +17.60%. In 2024 New York voted for Kathy Hochul for Governor by +6.34% while Onondaga County voted just to the left at +7.75%. On average of these four races New York voted for the Democrat candidate +12.49% while Onondaga County was +15.77%. So, on average Onondaga County is remarkably similar to New York in these races with just 2-3 points to the left.
That is, it is for this week’s edition of the #weeklywonk. Next week I will look at the biggest political subdivision in New York, the Supreme Court district. Made up of six different counties, it is even larger than congressional district in terms of registered voters. This is part 2 of my 9-part series on New York races running in Onondaga County. As always you can subscribe to dustinczarny.com for all content and election news updates.
The SAVE America Act could reshape New York state voting – Newschannel 9

“Our driver’s licenses in New York would not be valid proof of citizenship because they do not attest to citizenship on the face of the driver’s license itself, so they would either have to provide a passport or a birth certificate,” Czarny said.
https://www.localsyr.com/news/local-news/save-america-acts-possible-impact-on-nys-voting/

