Primary Day is Tuesday June 23rd. Polls are open 6am to 9pm. Democrats can vote county wide. Republicans in Pompey district 6. State Comptroller, Syracuse Common Councilor, Assembly District 29, and County legislature 8, 15, & 16 have primaries. Go to onvote.net to find your polling place and check your registration.
Subscribe to dustinczarny.com for all content and election news
“Of the 3,258 Democrats who cast ballots during the early voting period, 1,456 are registered in the 129th Assembly District where Brown is trying to unseat Magnarelli.
Voter turnout in the district – which spans most of Syracuse, and all of Geddes and Van Buren – was higher than any other part of the county, said Dustin Czarny, the Democratic elections commissioner.”
Welcome back to the #WeeklyWonk, my weekly article on Dustinczarny.com exploring election statistics and data. Each week, I examine a political subdivision with a competitive election this fall and analyze its voter registration, election results, and other relevant data. The goal is to help readers better understand the stories behind election outcomes across our home county of Onondaga. This week, I begin a series examining the towns that nominate candidates through caucuses for the fall elections. I start with the Town of Camillus, one of the most closely contested towns in 2025 and one that will again feature competitive races in 2026.
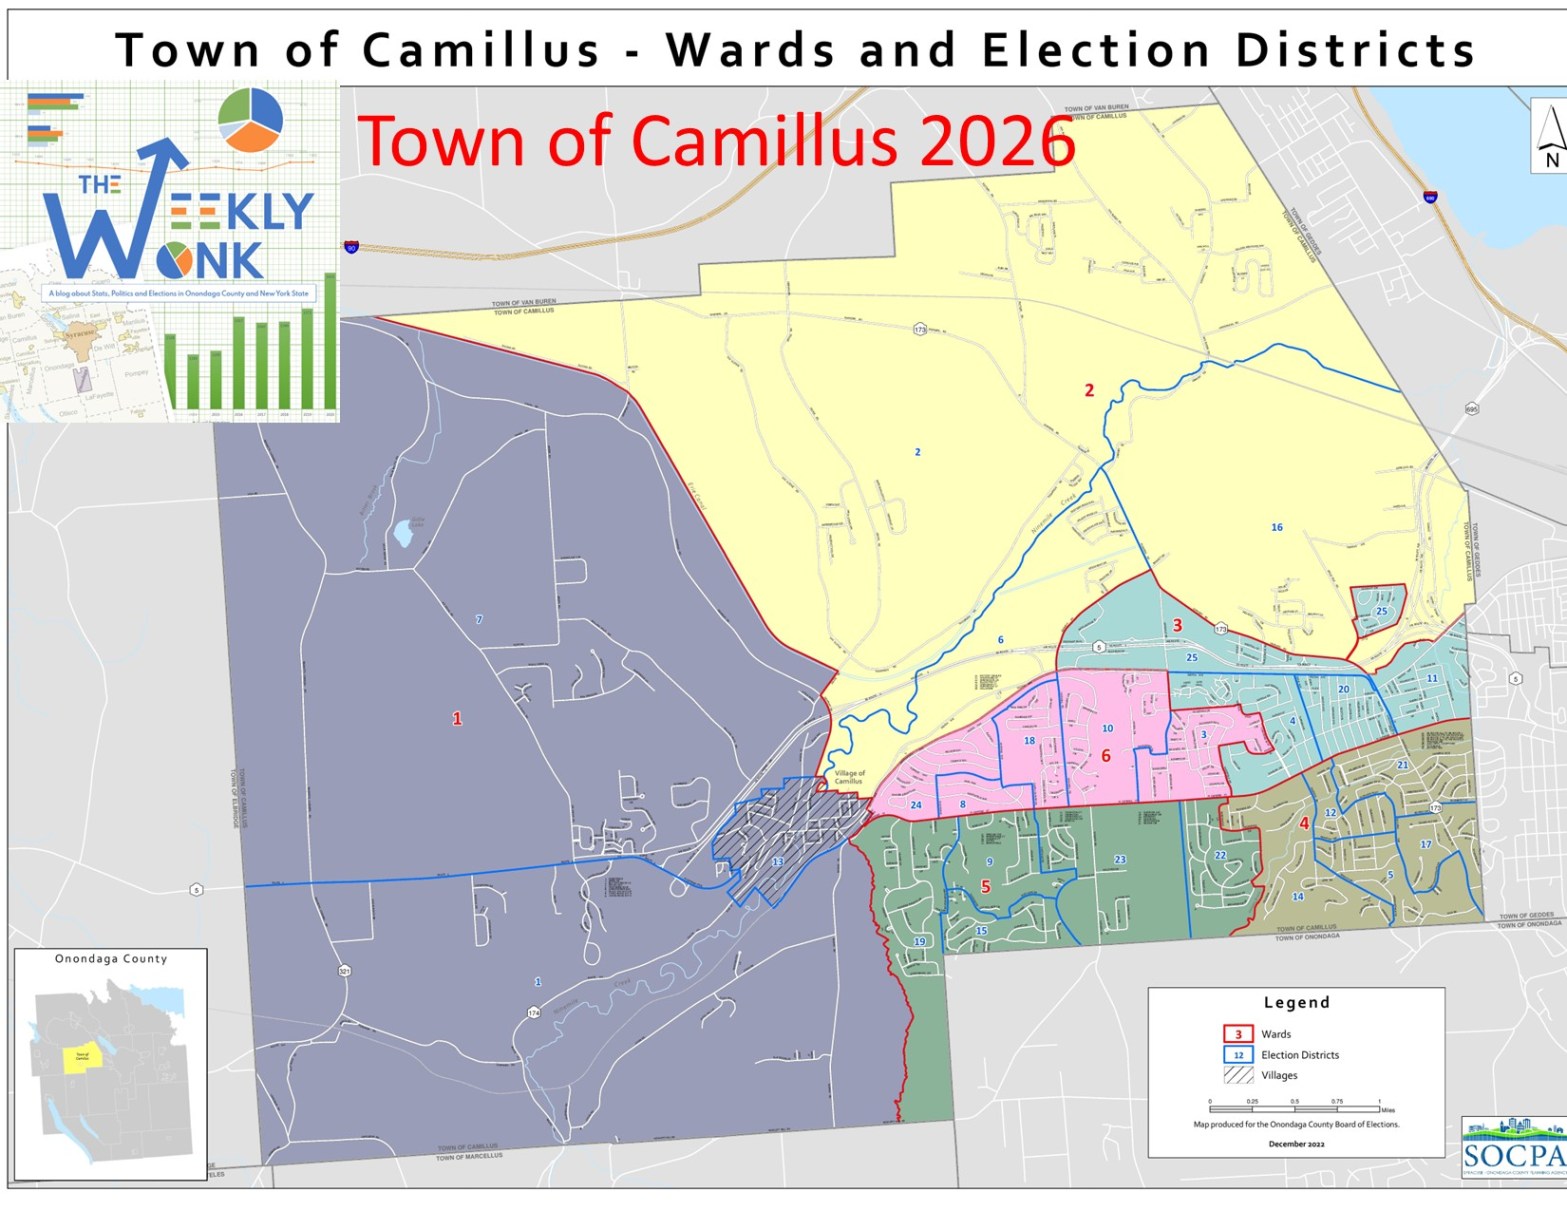
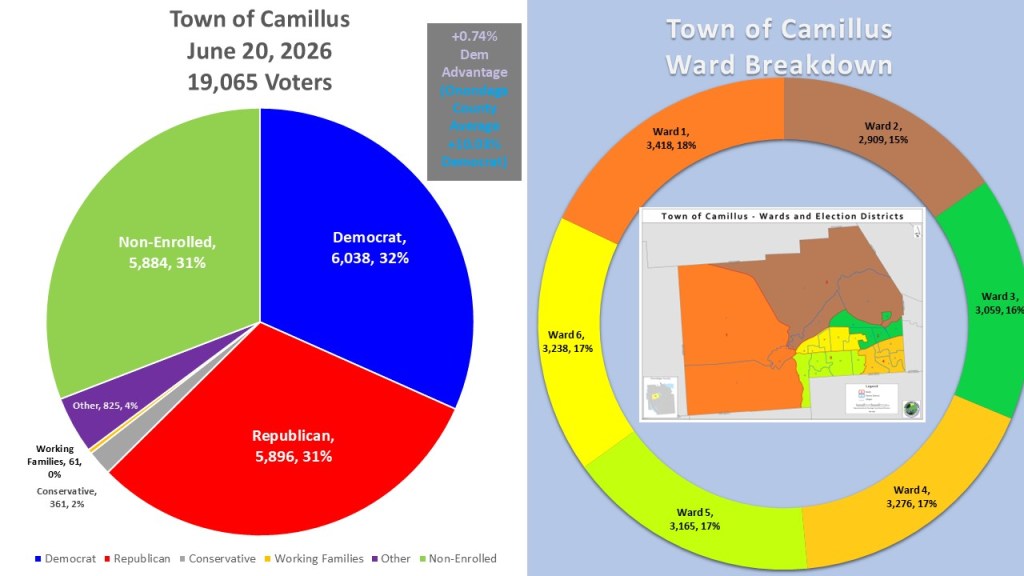
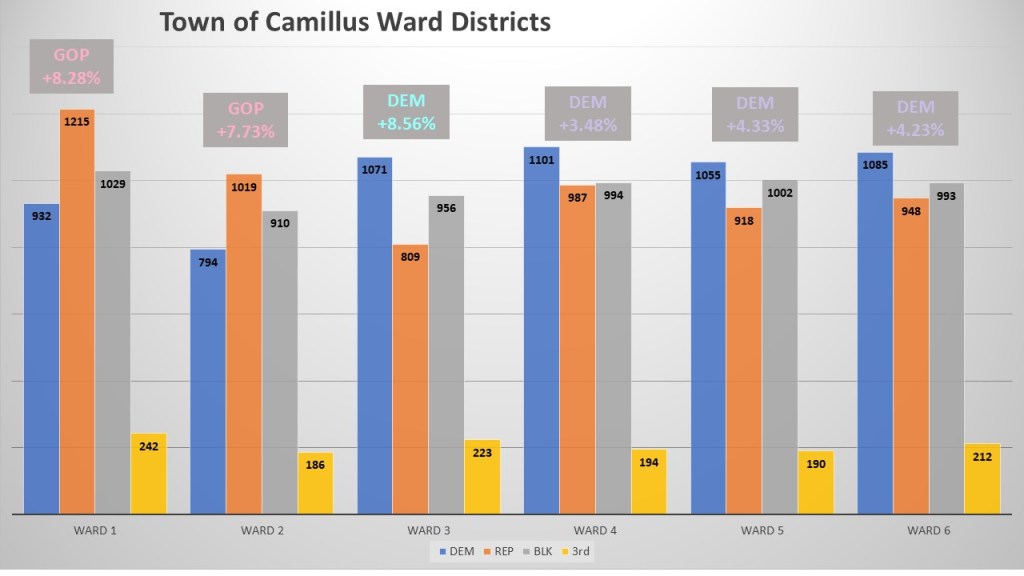
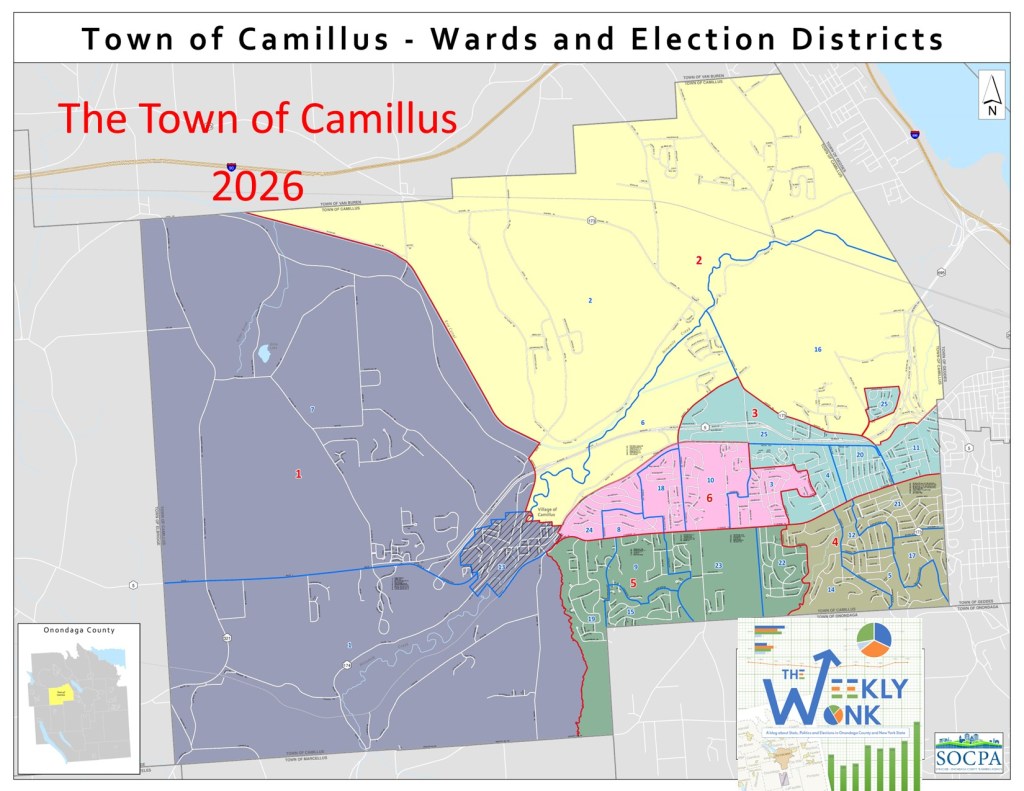
As of June 20, 2026, the Town of Camillus has 19,065 active voters. Democrats hold a narrow plurality with 6,038 voters (32%). Republicans are a close second with 5,896 voters (31%), while non-enrolled voters are an even closer third with 5,884 voters (31%). The remaining registration consists of voters in the “Other” category (825, 4%), the Conservative Party (361, 1%), and the Working Families Party (61, less than 1%). Democrats currently hold just a 0.74% registration advantage, making Camillus one of the most evenly divided towns in Onondaga County. Camillus is also one of only two towns in the county that elect Town Board members by ward rather than at-large. Instead of running townwide, candidates compete within six geographically defined wards, as shown in the chart above.
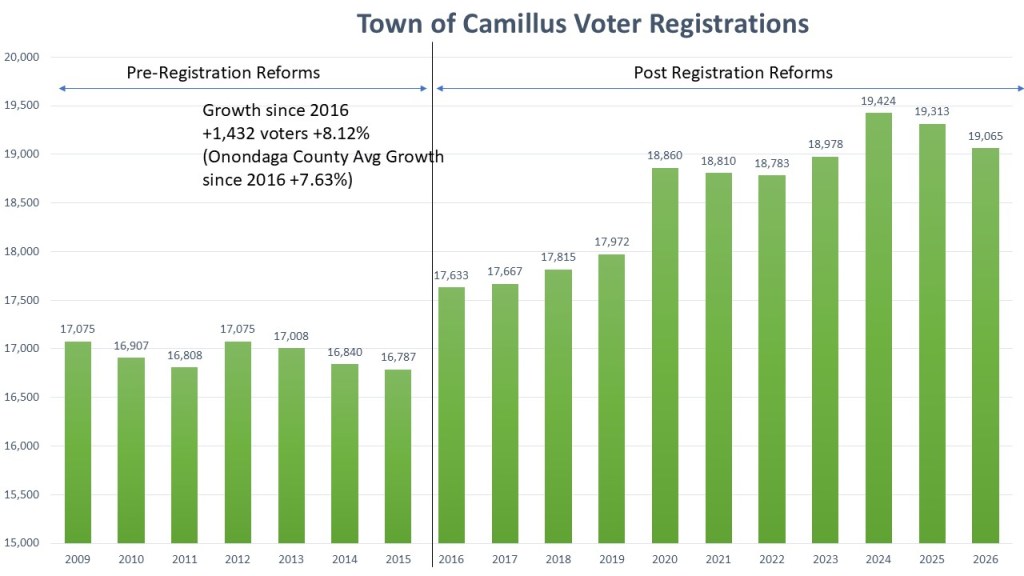
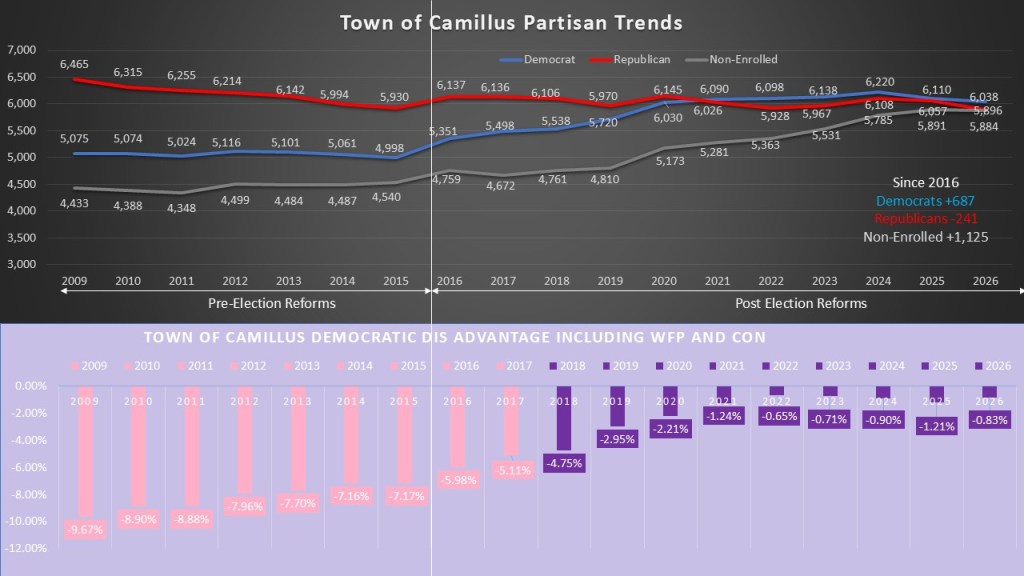
Unlike the state legislative districts analyzed in recent weeks, redistricting has had little impact on town boundaries. While minor adjustments occasionally occur in Camillus and Salina, the more significant factor affecting voter registration has been New York’s voting reforms. Beginning with online voter registration through the DMV in 2016 and accelerating with reforms enacted by the unified Democratic state government in 2019, voter registration has increased substantially. Since 2016, Camillus has added 1,432 active voters, an increase of 8.12%, slightly above Onondaga County’s overall growth rate of 7.63%.
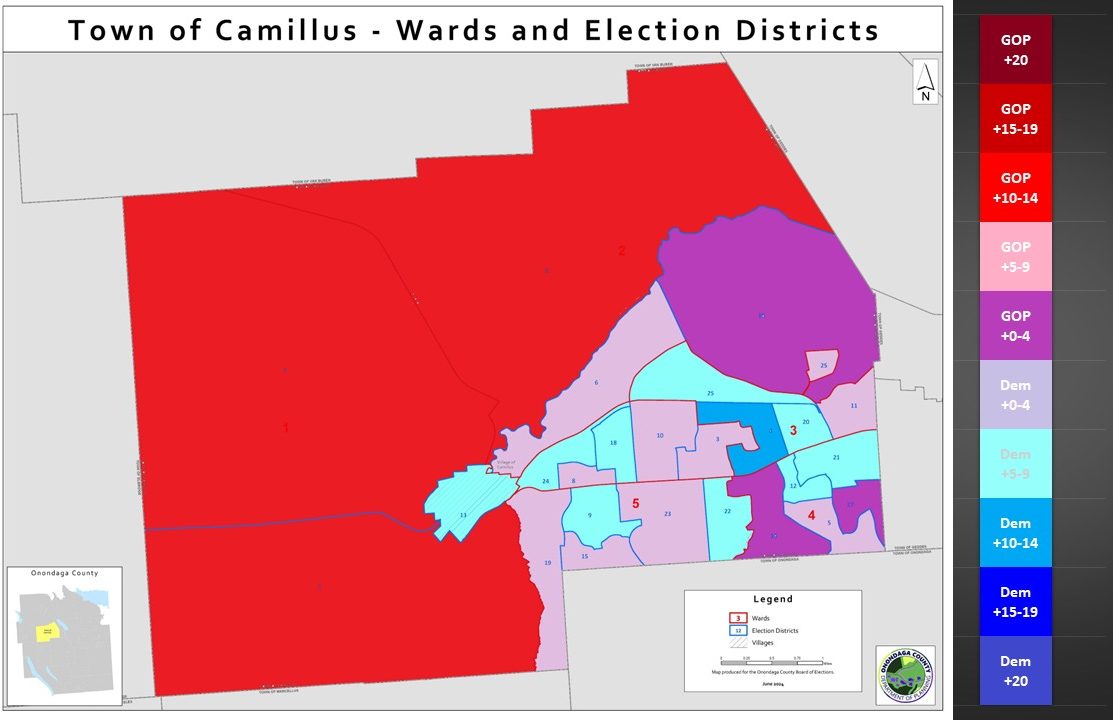
The registration heat map demonstrates just how evenly divided Camillus is, even at the election district level. Ten election districts fall into the light-purple category, indicating a slight Democratic advantage of 0–5%. Three districts are dark purple, reflecting a slight Republican advantage of 0–5%. Several districts are light blue, showing a Democratic advantage of 5–9%, while one district is solid blue with a Democratic advantage between 10% and 14%. Three northern and western election districts are solid red, indicating Republican advantages between 10% and 14%. Altogether, these patterns reinforce the balanced political nature of the town.
The ward structure further illustrates why Camillus remains so competitive. In 2025, Democrats won three Town Board seats for the first time in several election cycles. Those victories came in Ward 3, which has an 8.56% Democratic registration advantage; Ward 4, with a 3.48% Democratic advantage; and Ward 6, with a 4.23% Democratic advantage. Notably, these were the only wards where Democrats fielded candidates. Meanwhile, Republicans continue to represent Ward 1, where Republicans hold an 8.28% registration advantage; Ward 2, with a 7.73% Republican advantage; and Ward 5, despite a Democratic registration advantage of 3.48%. As a result, a gain of just one additional seat could shift control of the Town Board.
Like many suburban communities, Camillus has steadily become more competitive for Democrats over the last two decades. In 2009, the town maintained a clear Republican registration advantage. Democratic gains were already underway in many suburbs, but those gains accelerated after 2016 as suburban voters became increasingly receptive to Democratic candidates. Since 2016, Democrats have added 687 voters while Republicans have lost 241. The biggest story, however, is the growth of non-enrolled voters, who have increased by 1,125 registrants and now nearly equal Republicans in number. Despite the Democrats’ narrow registration edge, Republicans still benefit from the presence of the Conservative Party, whose voters typically support Republican candidates at much higher rates than Working Families Party voters support Democratic candidates. When Conservative registrations are combined with Republican registrations, right-leaning candidates hold an effective registration advantage of approximately 0.83%.
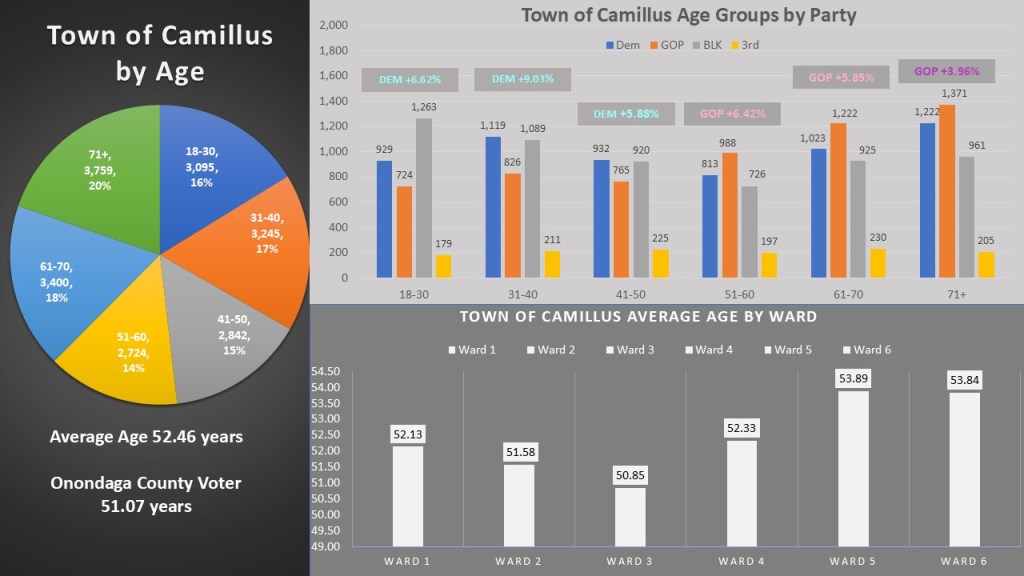
Age demographics provide another example of Camillus’s political divide. The average voter age in the town is 52.46 years, slightly older than the countywide average of 51.07 years. Voters aged 71 and older make up the largest age group at 20% of the electorate. At the same time, younger voters are becoming increasingly influential. Voters under age 50 generally lean Democratic, while voters over age 50 tend to lean Republican. The wards tell an interesting story as well. Ward 3 is the youngest, with an average voter age of 50.85 years, slightly younger than the county average. Ward 2 follows at 51.58 years. Wards 1 (52.13) and 4 (52.33) are close to the town average, while Wards 5 (53.89) and 6 (53.84) are significantly older than the rest of the town.
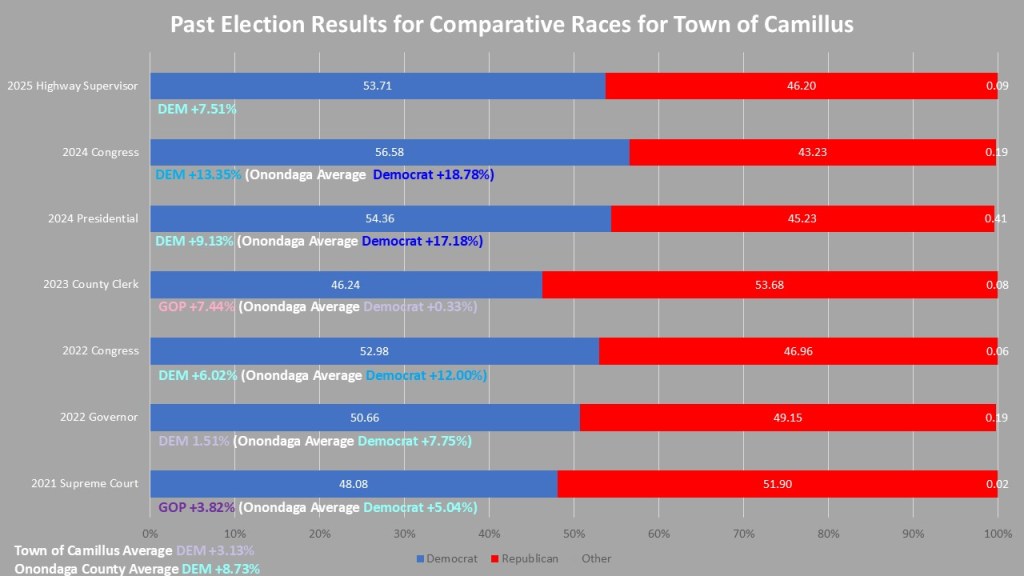
Camillus also behaves differently in even-year and odd-year elections. In the seven federal and statewide races included in this analysis, Camillus has generally favored Democrats. In 2024, John Mannion carried the town by 13.35%, while Kamala Harris won it by 9.13%. In gubernatorial election years, however, results are much closer. Fran Conole carried Camillus by 6.02% in his congressional race, while Governor Kathy Hochul won the town by only 1.51%. Odd-year elections have tended to favor Republicans. In 2023, Lisa Dell carried Camillus by 7.44% in the County Clerk race, while Danielle Fogel won the town by 3.82% during her successful campaign for State Supreme Court. This makes Ken Stoneberg’s 7.15% victory for Town Supervisor in 2025 particularly notable for a Democratic candidate. Across all comparable races, Democrats average a 3.13% advantage in Camillus, considerably lower than the countywide average Democratic advantage of 8.73%.
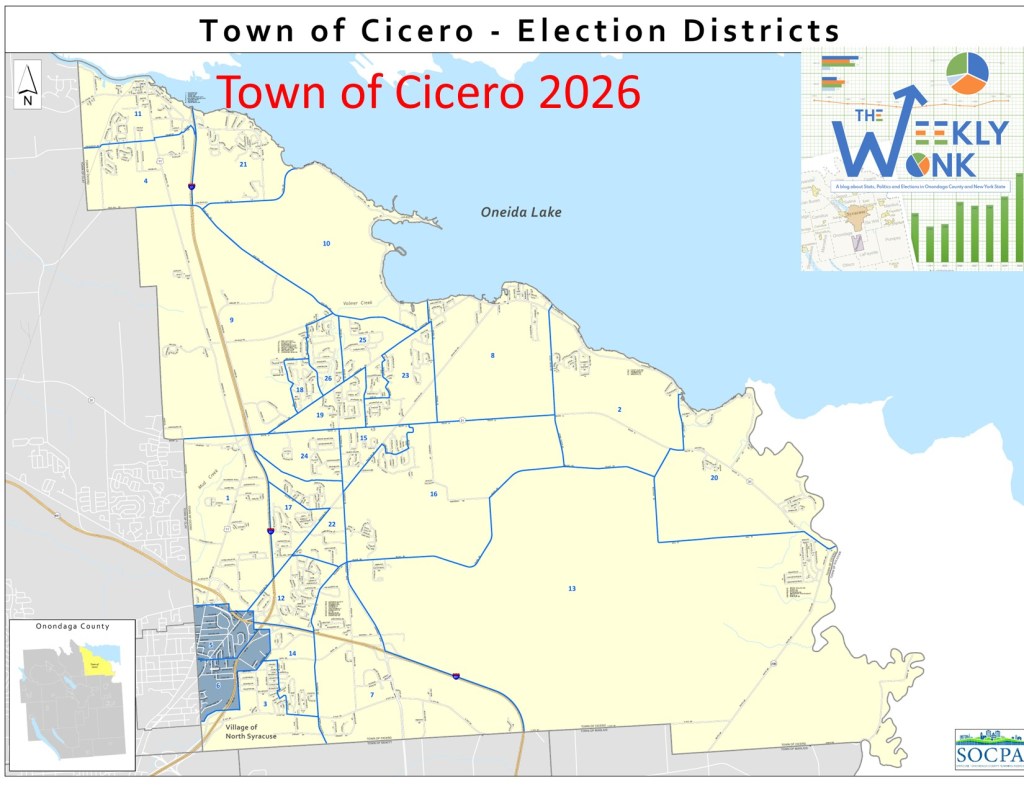
That’s it for this week’s edition of the #WeeklyWonk. Next week, I will continue my tour of the caucus towns with the Town of Cicero. While traditionally one of the reddest towns in Onondaga County, Cicero has produced a few surprises in recent years. We’ll take a closer look at the data and see what trends may be emerging there. As always, subscribe to Dustinczarny.com for future editions, election analysis, and the latest election news from Onondaga County and beyond.
Today we are running two elections in one day! The North Syracuse village election with polls open from noon to 9pm. And #EarlyVoting For the June 23rd primary is also underway. I talk about how both came to be run in the same room in the North Syracuse Community Center on the same day and how we were never supposed to be doing either this year. I also give a turnout update on #earlyvoting. Enjoy.
Subscribe to dustinczarny.com for all content and election news updates
“while we have assurances from the post office that election mail will get extraordinary measures near election day, I have been advising all voters to turn in their ballot as soon as possible.”
This week’s episode I talk about Golden Day. The second most important day in nan Election cycle. This Saturday is the first day of Early Voting, the last day to register to vote, and the last day to request a vote by mail ballot be mailed to you for the June 23rd Primary. Learn all about how we got here and what it means. Enjoy.
Subscribe to dustinczarny.com for all content and election news updates
Welcome back to the #weeklywonk. This is my weekly article on dustinczarny.com on statistics and data. Each week I look at a political subdivision having a competitive election this fall and analyze the registration, electoral, and other pertinent data that encompasses it. This helps you understand the story behind election results in our home of Onondaga County. This week I finished my investigations of the 4 Assembly districts that represent Onondaga County. NY Assembly district 129th represents towns of Geddes, Van Buren and three quarters of the City of Syracuse in Onondaga County. William Magnarelli (D) represents this district serving continuously from 1998. This is the only Assembly district in a primary as with Onondaga County Legislator Maurice Brown (D) mounting the challenge.
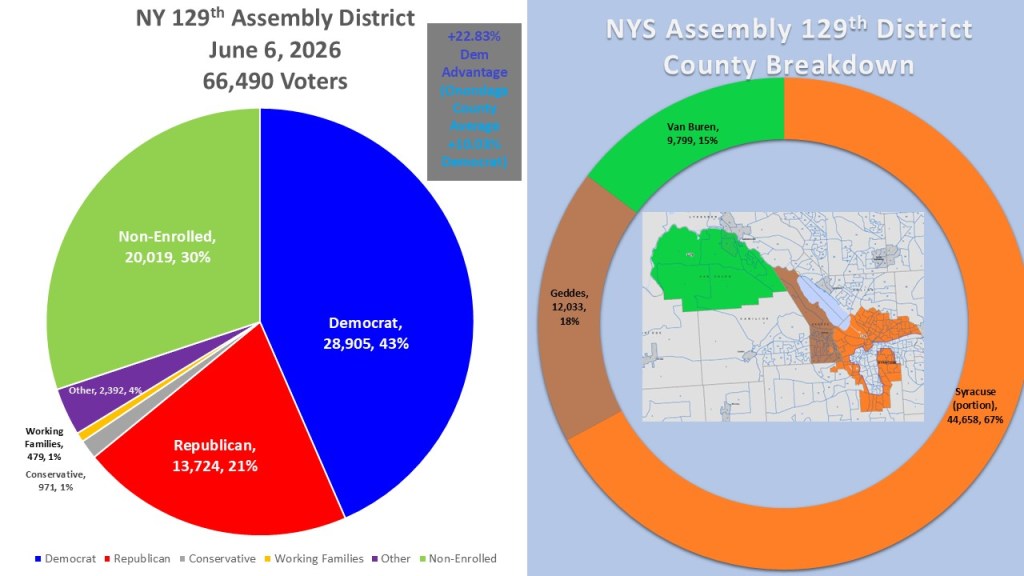
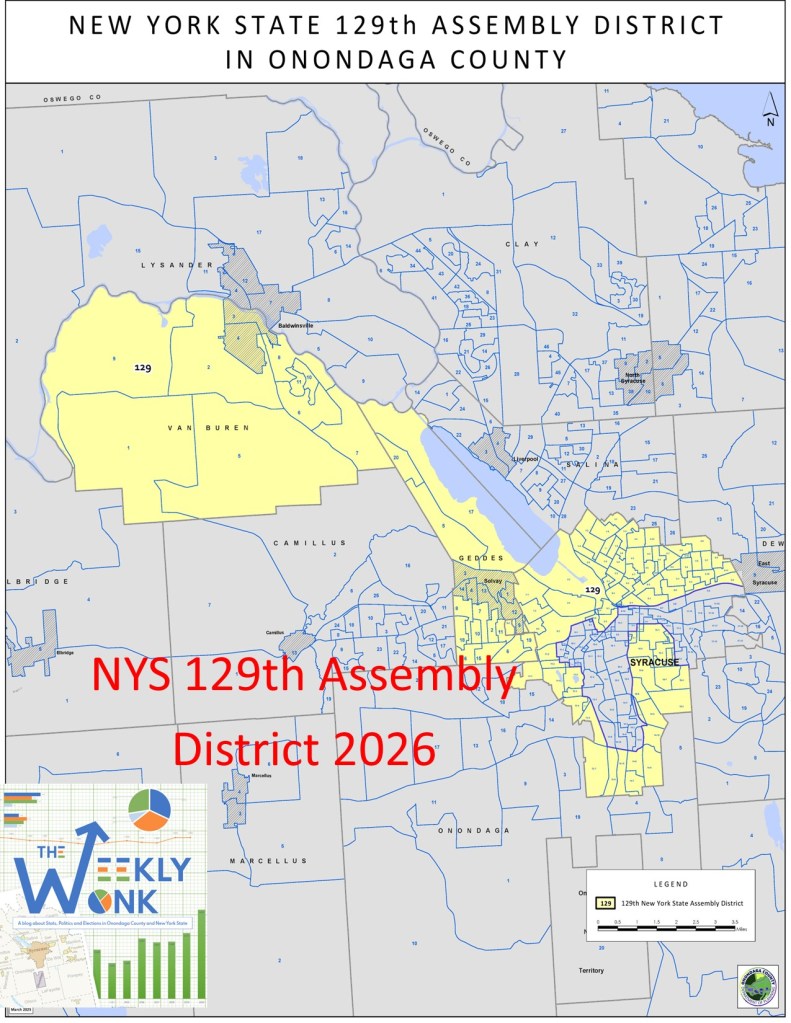
NY Assembly District 129th is the other district inside Onondaga County. This means that this weekly work can solely rely on data from the Onondaga County Board of Elections. As of June 6, 2026, we see the district has 66,490 active voters. Democrats hold a large plurality with 28,905 voters (43%). The non-enrolled are second, with 20,019 voters (30%). The GOP is a distant third with 13,724 voters (21%). Rounding out the registration is the other category (2,392, 4%), Conservative Party (971 1%), and Working Families (479, 1%). Democrats have a +22.83% advantage in the district which is the biggest of all four Assembly districts. The Syracuse portion has the most voters in the district with 66% (44,658) of the active voters. The Two Towns trail by a great deal. Geddes is second with 18% (12,033 voters). Van Buren is third with 15% (9,799 voters). Overall, this district split even between these four political subdivisions.
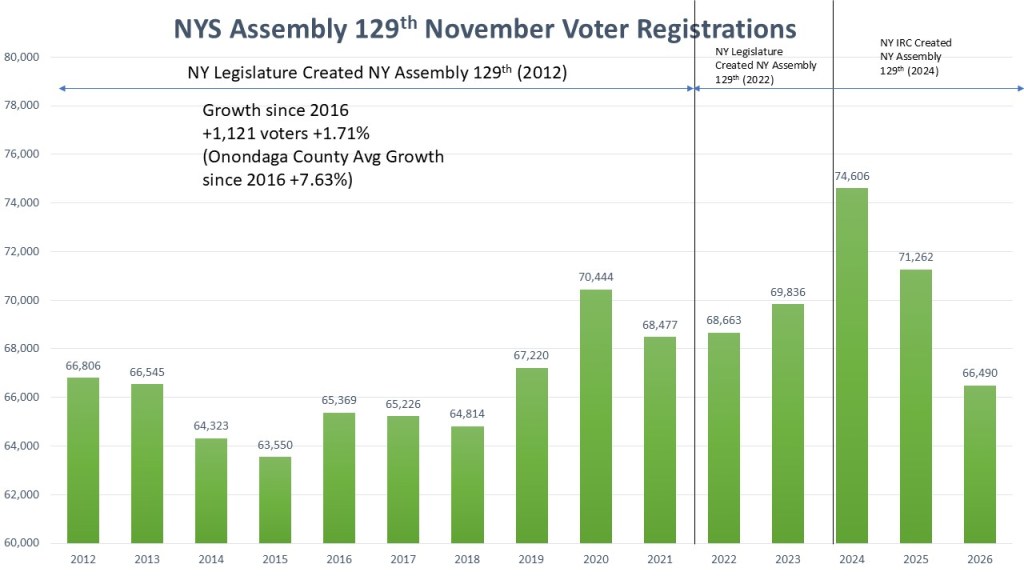
As we noted in the last few editions, the story of redistricting for Assembly districts is a little different than the Senate and Congressional districts. Like the Congressional districts, Assembly members have run on three different maps of the last three cycles, but the Assembly district maps were never drawn by the NY Judiciary as they were never part of the lawsuit in 2022 thus the NY Legislature maps created in 2022 stood until a separate lawsuit required the NY IRC. Like most Assembly Districts, AD 129 there was no change in the 2012, 2022 & 2024 maps. There were also only minor changes around borders inside the City of Syracuse portion of the district. One of the advantages of having a district inside Onondaga County is getting up to date registration information. But this is why we see a major drop in registrations in 2026. The mail check cards along with NVRA and National Change of Address. All of this is how we clean our voting rolls by taking voters off the active rolls that have mail returned. This adversely affects the City of Syracuse and specially student population of Syracuse University who drop substantially in non -presidential years, This is why the growth of the district since 2016 is essentially flat, with growth only being 1,121 voters, a growth rate of 1.71% slower than the growth rate we saw in Onondaga County during that period of 7.63%.
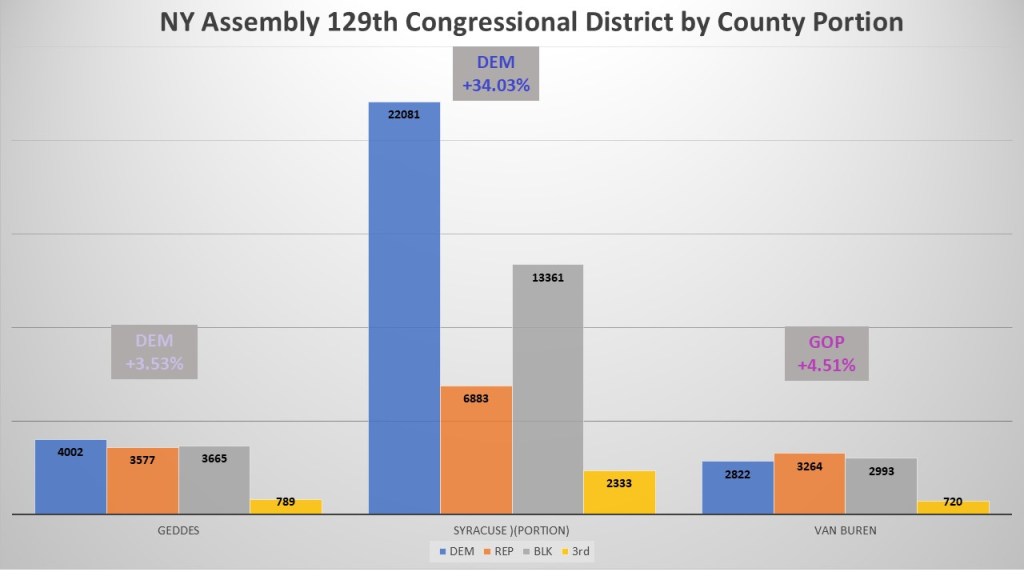
Focusing on the district’s political subdivisions reveals how the City of Syracuse portion dwarfs and shapes the district. Not only does the City of Syracuse portion double up both towns put together, the extreme partisan domination of Democrats in the district shapes the partisan leans of the district. Democrats enjoy a +34.03% partisanship lean with Democrats have seen times more and non-enrolled have over three times more voters than Republicans. Democrats have only a borderline lead in the town of Geddes (+3.53%) and trail in the town of Van Buren (GOP +4.51%). However, the substantial number of voters in Syracuse is what gives the district its overwhelming Democratic lean.
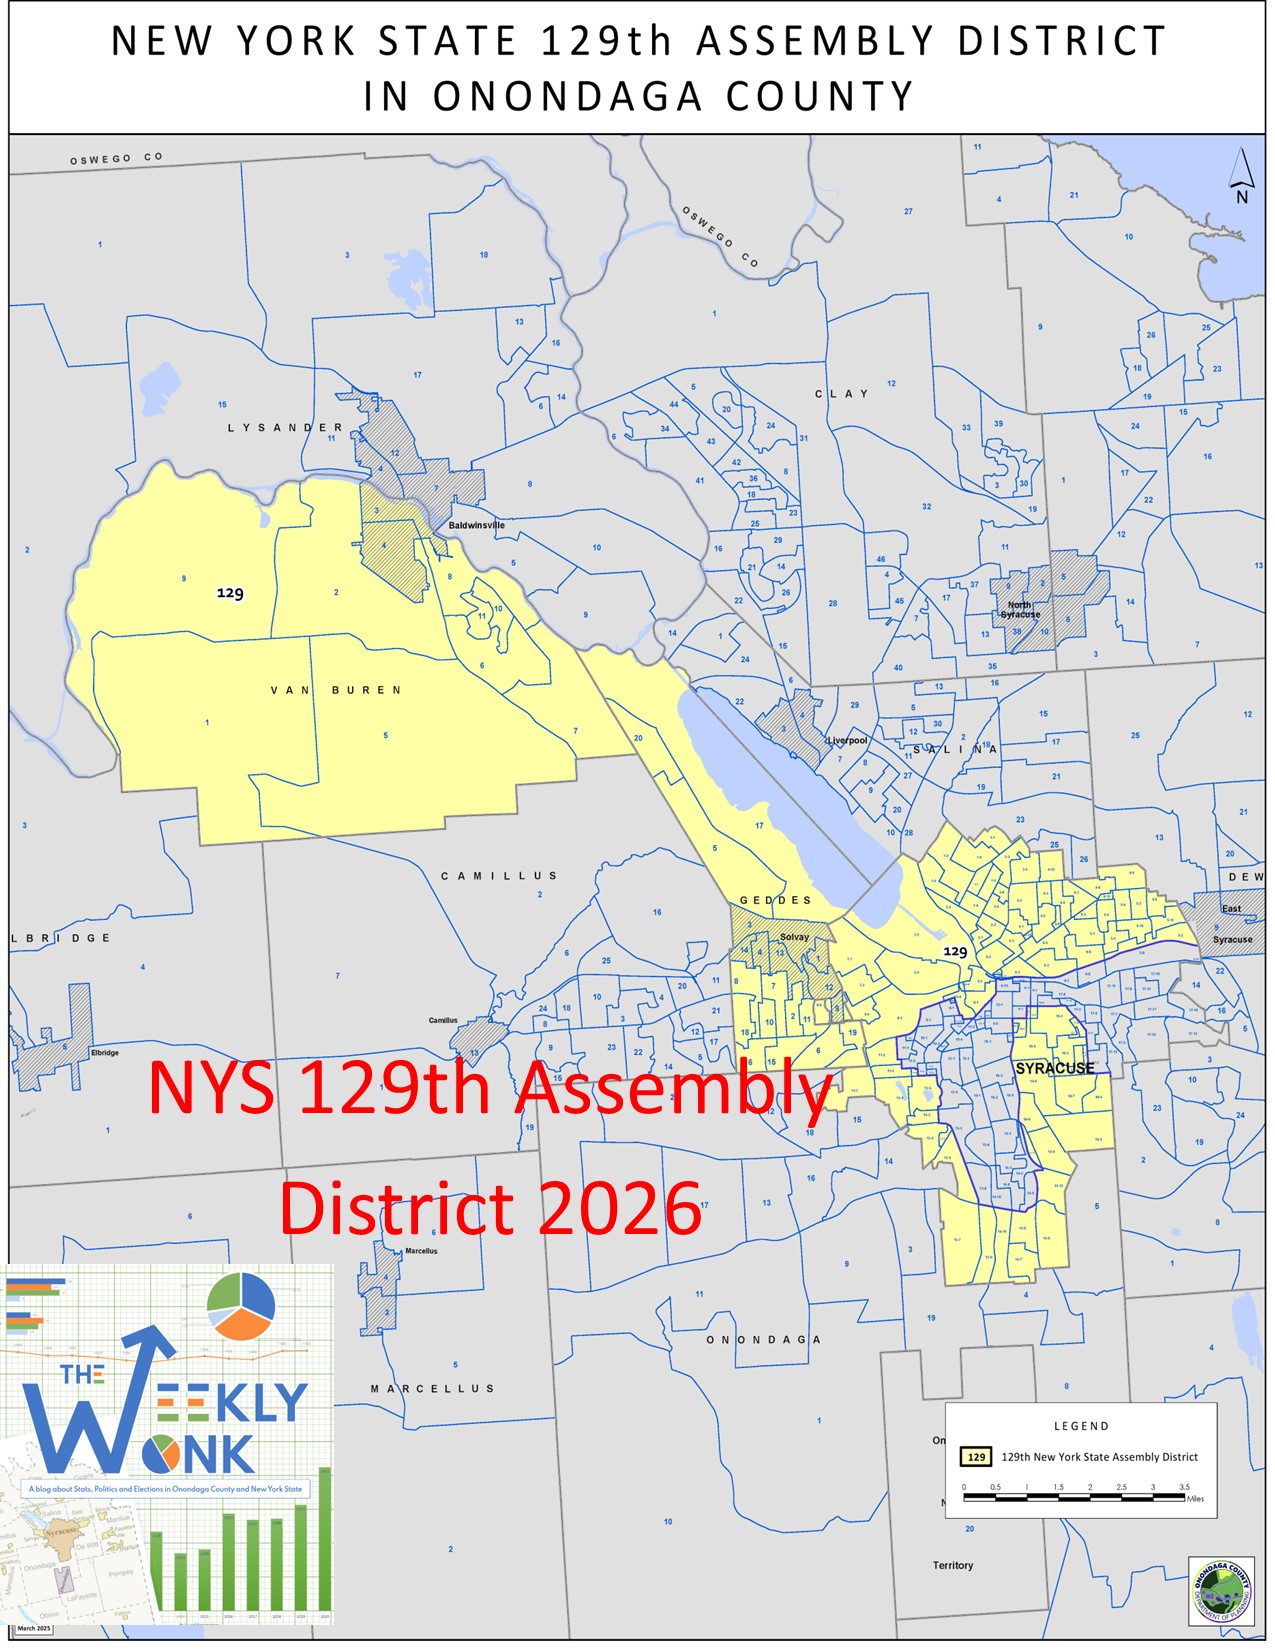
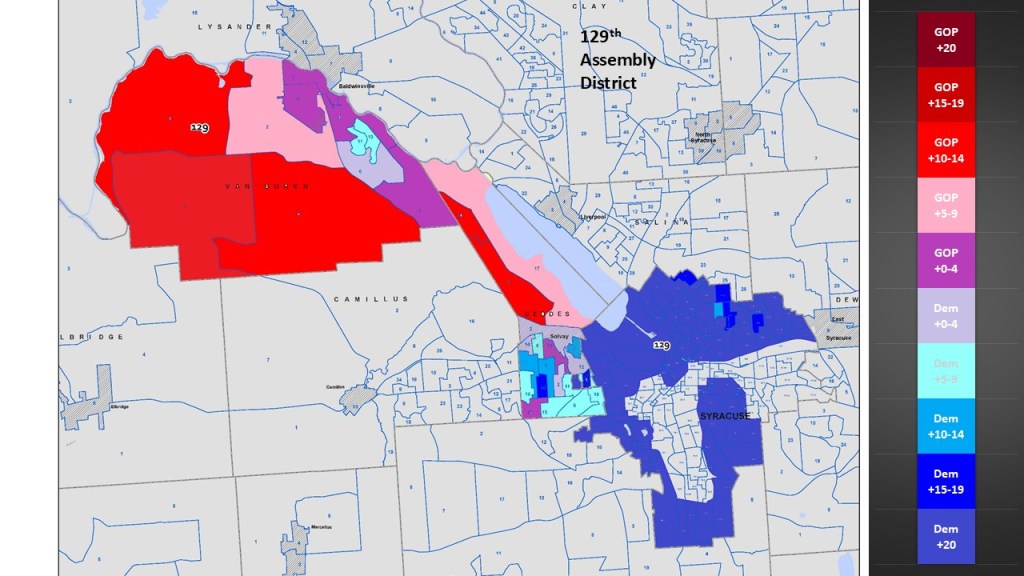
Another advantage to analyzing a district inside of Onondaga County is more data readily at hand. This allows me to get a little more granular on our heat map. In this map I color code the leanings of every election district in the 129th. Here we see that Syracuse is dominant blue but with six eds on the north side not in the most dominant +20% range. The town of Geddes is mostly in blue in the Solvay and Fairmount portions, though there are borderline GOP eds in purple. As we went north into Lakeland, only then do we see GOP leaning districts in pink and aligned districts in red. Though Baldwinsville and surrounding areas in Van Buren do have three borderline GOP, one borderline Dem district and even two leaning Dem districts.
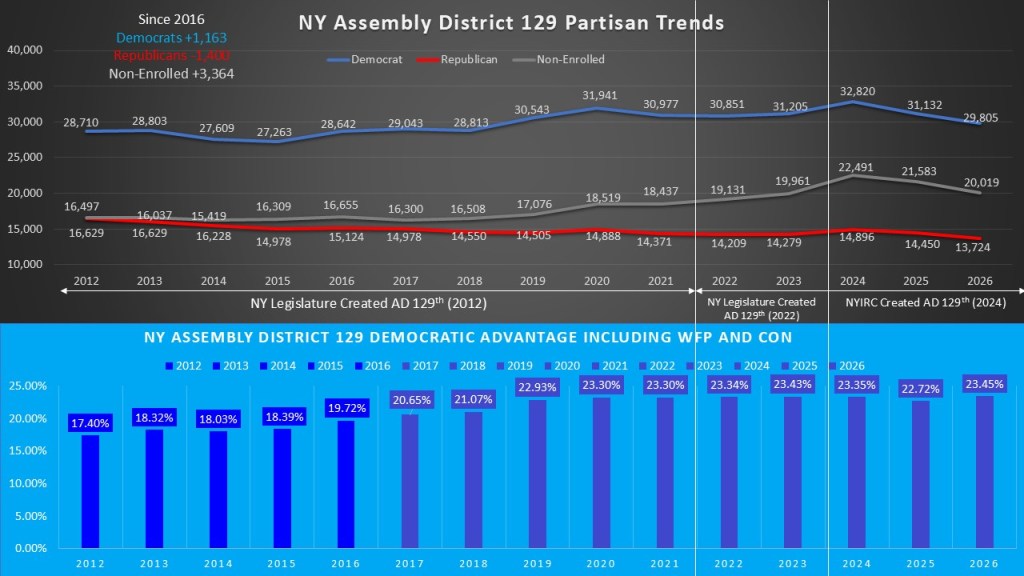
Looking at the district’s partisan trends the stableness of the district has led to flat partisan baselines of Democrats and Republicans. Since 2016 Democrats have gained 1.163 voters. In the inverse the GOP has done a great deal worse, losing 1,400 voters since 2016. Like most districts the non-enrolled surge is prevalent. Since 2016 non-enrolled have gained 3,364 voters. The rise of the non-enrolled and flattening of the Democratic growth is also flattening the ideological gain of this district. Though the City of Syracuse lost voters each year, this has not led to a loss of left leaning ideological dominance in the district. The district grew consistently from 2012 (+17.99%) to 2026 (+23.45%). As of time of pulling data this is the best the left ideologies have dominated this district.
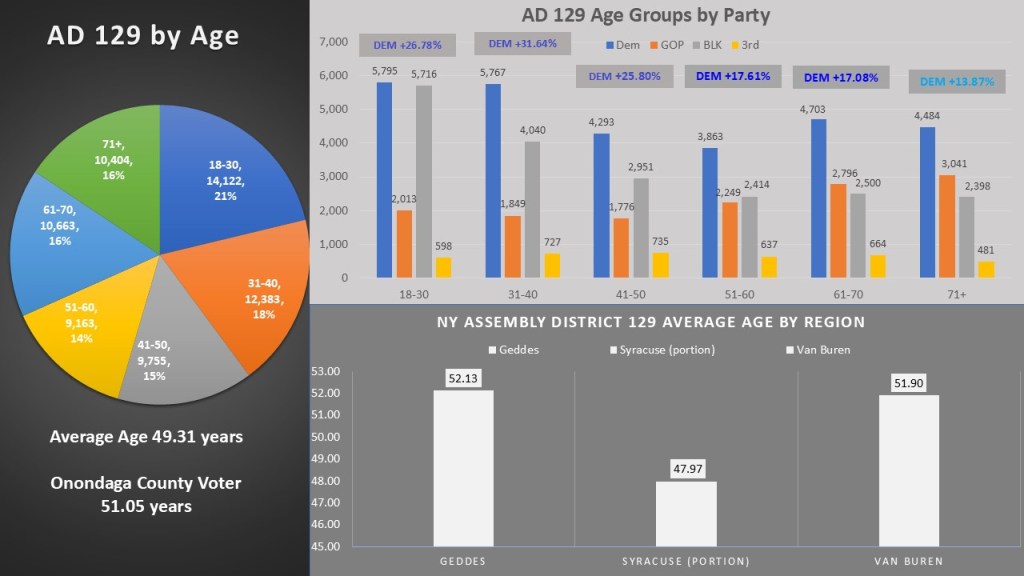
Once again, the fact that this district lays entirely inside of Onondaga County I have more tools to use to get a good picture of the district. This year I wanted to look at the age registered voters to get an idea of the differences in different communities. The average age of Onondaga County is 51.05 years. AD 129th is the youngest of the four Assembly districts. Because of the influence of Syracuse University, the 18-30 age group holds the plurality (21%). The differences in ages really come in the Towns and Syracuse portion. We also see that though the non-enrolled are more prevalent in the under fifty age ranges, Democrats still hold the plurality in all the age groups, even the 18-30 group. Both towns’ Geddes (52.13), and Van Buren (51.90) are older than the average age of the county and Syracuse portion (47.97) is much younger.
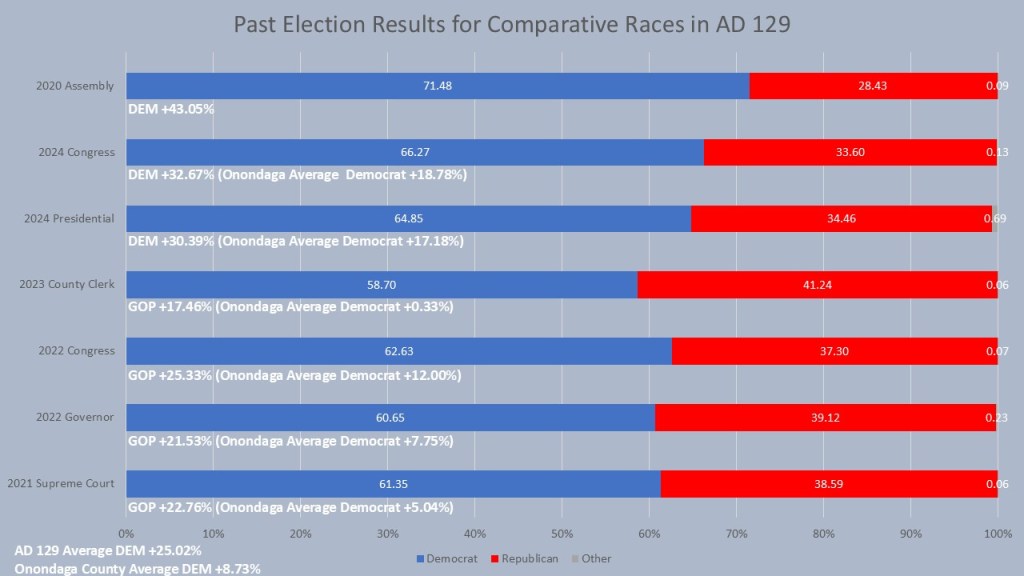
Now that we are back in Onondaga County, I can use our system to look at the comparison races for this year. This gives us an idea of how this district performs in comparison to the rest of the county in similar races. First off, we look at the last result in the district itself, however the last contested contest in the district was in 2020. Bill Magnarelli easily won re-election with +43.05% of the vote. To get an idea of how this district performs we must look at the comparative races. Mannion for Congress (+32.67%) and Kamala Harris (+30.39%) performed their best in this district in 2024. In the mid-term year in 2022 Governor Hochul won the district by 21.53% and Fran Canole won the district by 25.33%, though both performed better in AD 128. This district performs differently in odd years with Emily Essi’s county clerk race only winning the seat by 17.46% and the 2021 Supreme Court race, Brindisi won this district by 22.76%, though both did better in this district than any other Assembly. The Democratic performance in this Assembly District in the six comparative races the district averaged +25.02% for the Democrats while Onondaga County averaged +8.73% in those races. This is the best of all Assembly Districts in Onondaga County.
As we close this edition of the #weeklywonk it is important to note that that AD 129 is the youngest, best in Democratic registration, and best in Democratic performance of all four Onondaga County Assembly districts. Next week I will turn my attention back to the towns of Onondaga County. This time I will focus on the towns that nominate candidates for office by caucus. We will start with the battleground town of Camillus. As always, you can subscribe to dustinczarny.com for all content and election news updates.
This week’s episode I talk about the final release of Early voting sites. Why we have grown from 6 to 8 Early voting EV sites, the 10 General Election EV sites. I also talk about the role Pre Clearance with the New York Voting Rights Act played and why Onondaga County is on the list. Enjoy.
Subscribe to dustinczarny.com for all content and election news updates
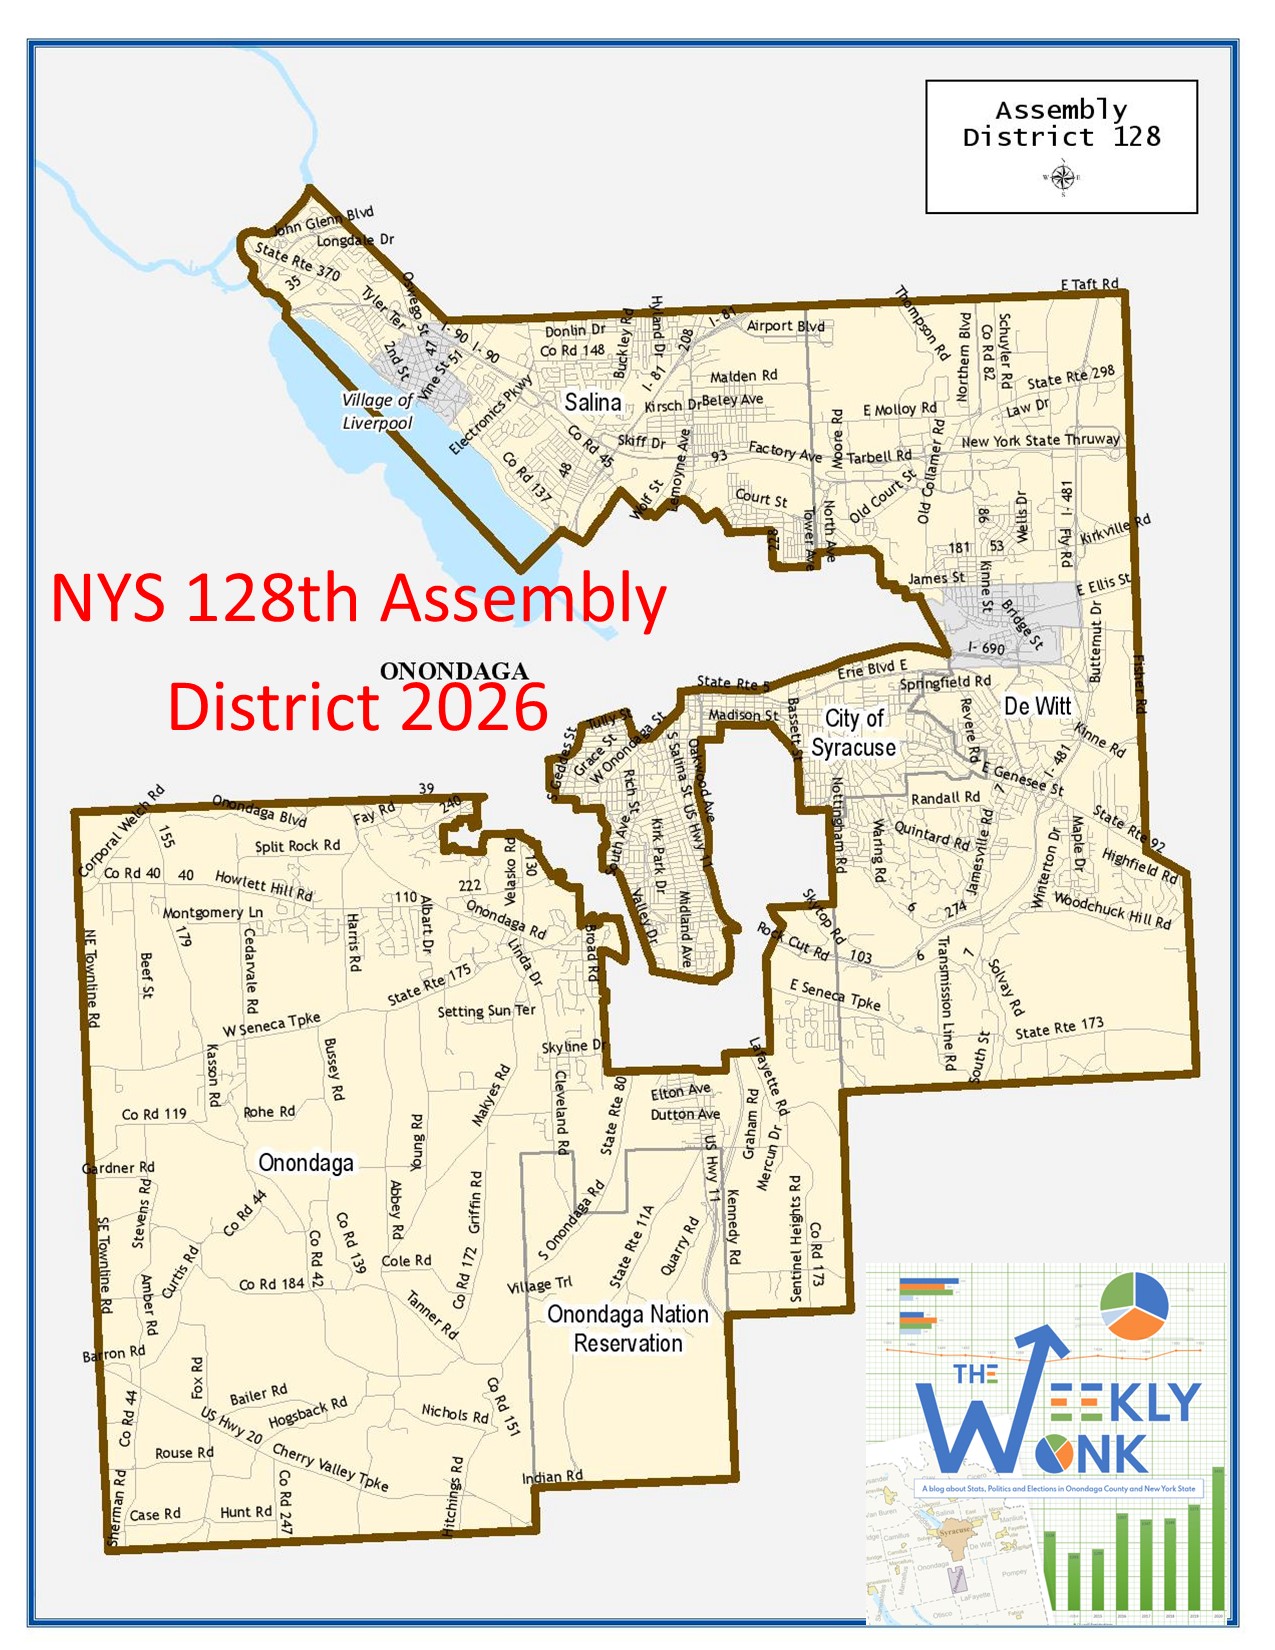
Welcome back to the #weeklywonk. This is my weekly article on dustinczarny.com on statistics and data. Each week I look at a political subdivision having a competitive election this fall and analyze the registration, electoral, and other pertinent data that encompasses it. This helps you understand the story behind election results in our home of Onondaga County. This week I will continue my investigations of the 4 Assembly districts that represent Onondaga County. NY Assembly district 128th represents towns of Dewitt, Onondaga, and Salina and a good portion of the City of Syracuse in Onondaga County. AD 128 represents this district serving from 2008-10 and continuously since 2012.
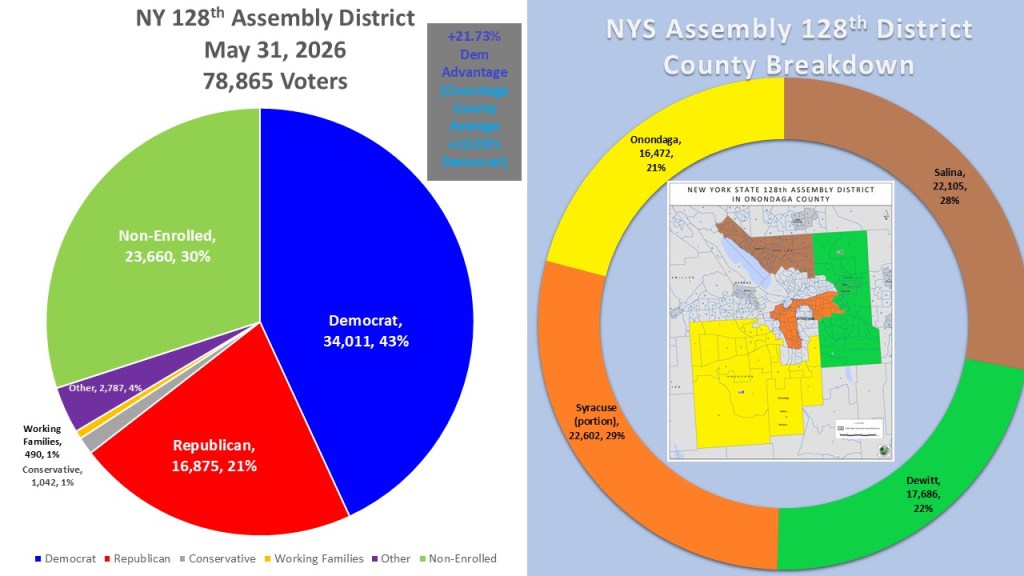
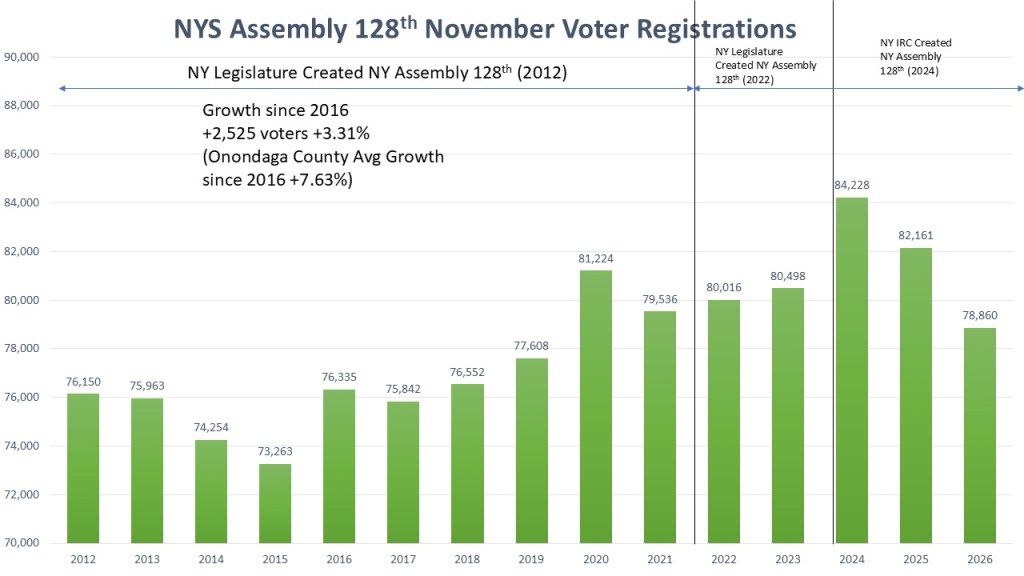
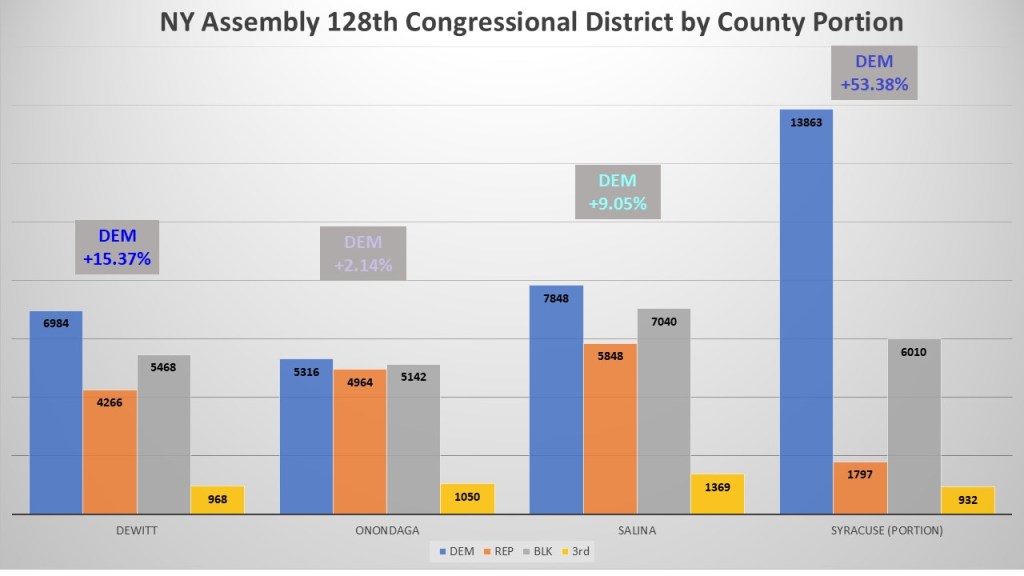
NY Assembly District 128th is inside Onondaga County. This means that this weekly work can solely rely on data from the Onondaga County Board of Elections. As of May 31, 2026, we see the district has 78,865 active voters. Democrats hold a large plurality with 34,011 voters (43%). The non-enrolled are second, with 23,660 voters (30%). The GOP is a distant third with 16,875 voters (21%). Rounding out the registration is the other category (2,787, 4%), Conservative Party (1,042 1%), and Working Families (490, 1%). The Syracuse portion has the greatest plurality in the district with 29% (22,602 voters) of the active voters. In a remarkably close second place is Salina with 28% (22,105 voters). Dewitt is third with 22% (17,686 voters) and Onondaga is close fourth with 21% (16,472 voters). Overall, this district split even between these four political subdivisions.
As we noted in the last couple of weeks, the story of redistricting for Assembly districts is a little different than the Senate and Congressional districts. Like the Congressional districts, Assembly members have run on three different maps of the last three cycles, but the Assembly district maps were never drawn by the NY Judiciary as they were never part of the lawsuit in 2022 thus the NY Legislature maps created in 2022 stood until a separate lawsuit required the NY IRC. Like most Assembly Districts, AD 128 there was no change in the 2012, 2022 & 2024 maps. There were also only minor changes around borders inside the City of Syracuse portion of the district. One of the advantages of having a district inside Onondaga County is getting up to date registration information. But this is why we see a major drop in registrations in n2026. The mail check cards along with NVRA and National Change of Address. All of this is how we clean our voting rolls by taking voters off the active rolls that have mail returned. This adversely affects the City of Syracuse and specially the east side with high student voter population who are very transitory in non -presidential years, This is why the growth of the district since 2016 is essentially flat, with growth only being 2,525 voters, a growth rate of 3.31% slower than the growth rate we saw in Onondaga County during that period of 7.63%.
Focusing on the district’s four political subdivisions reveals how the City of Syracuse portion dominates the district. While overall the City of Syracuse portion is not that much more in voters than the other three, the extreme partisan domination of Democrats in the district shapes the partisan leans of the district. Democrats enjoy a +53.38% partisanship lean with Democrats have seen times more and non-enrolled have over three times more voters than Republicans. However, Democrats also dominate the towns of Dewitt (+15.37%) and Salina (+9.05%). The town of Onondaga even has a border line Democratic lean of +2.14%. What is also interesting is even in the towns non-enrolled outnumber the Republicans.
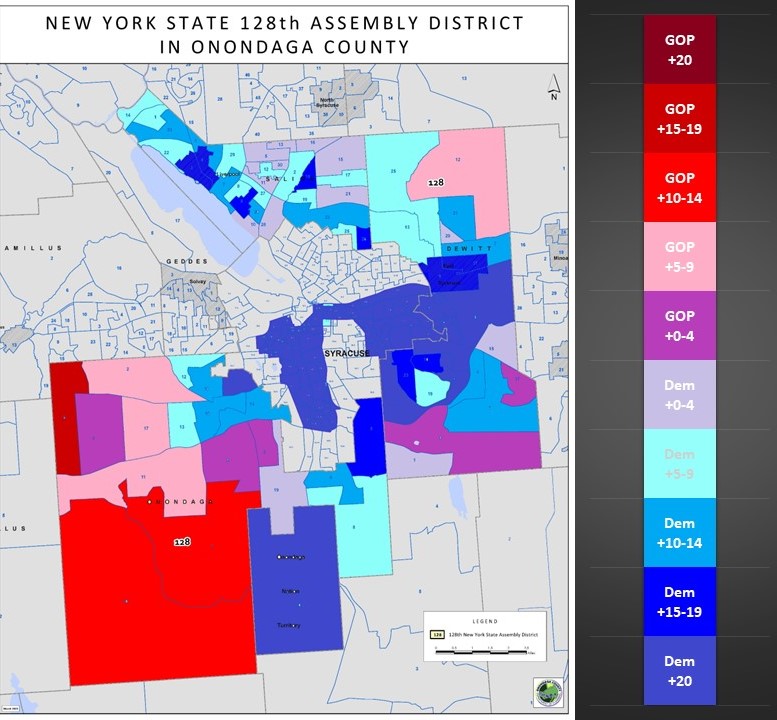
Another advantage to analyzing a district inside of Onondaga County is more data readily at hand. This allows me to get a little more granular on our heat map. In this map I color code the leanings of every election district in the 128th. Here we see that Syracuse is dominant blue but so are portions of Dewitt Salina, and Onondaga that border the city. In fact, all of Salina districts have a Democratic lean. There are only seven election districts in the entire district, one in Dewitt, and six in Onondaga that have definitive GOP leans. The are also five more election districts with borderline GOP leans noted by the dark purple (3 in Onondaga and two in Dewitt. Outside of that everywhere on the map has a Democratic lean, and often it is definitive.
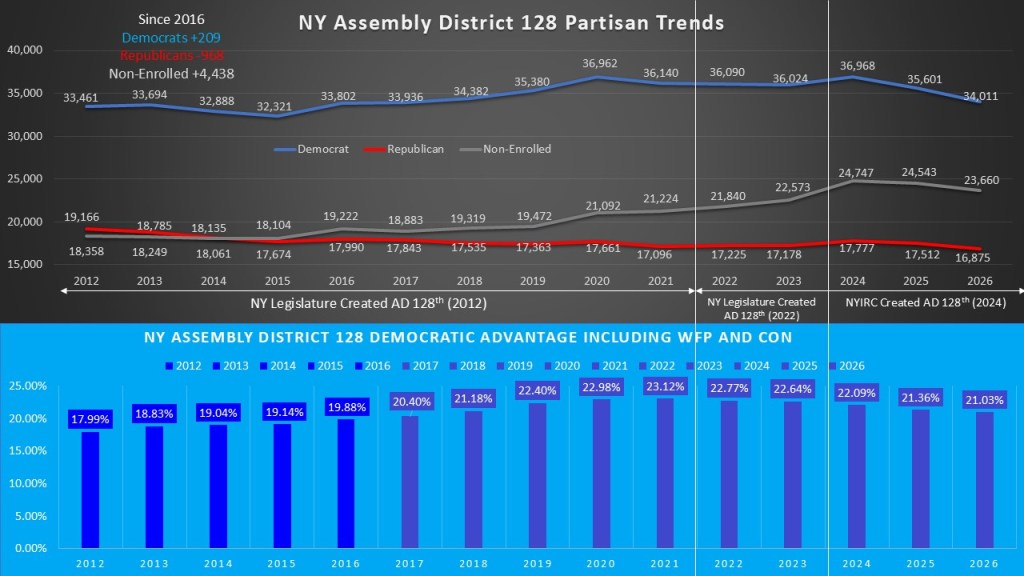
Looking at the district’s partisan trends the stableness of the district has led to flat partisan baselines of Democrats and Republicans. Since 2016 Democrats have only gained 209 voters. In the inverse the GOP has done a tad bit worse, losing 968 voters since 2016. Like most districts the non-enrolled surge is prevalent. Since 2016 non-enrolled have gained 4,438 voters. The rise of the non-enrolled and flattening of the Democratic growth is also flattening the ideological gain of this district. When we add the WFP to the Democratic column and the conservatives in with the Republican the difference is the ideological leaning of the district. The district grew consistently from 2012 (+17.99%) to 2021 (+23.12%). However, as the partisan lines flatlined and the non-enrolled grew, we have seen a retreat since then to just +21.03% in 2026.
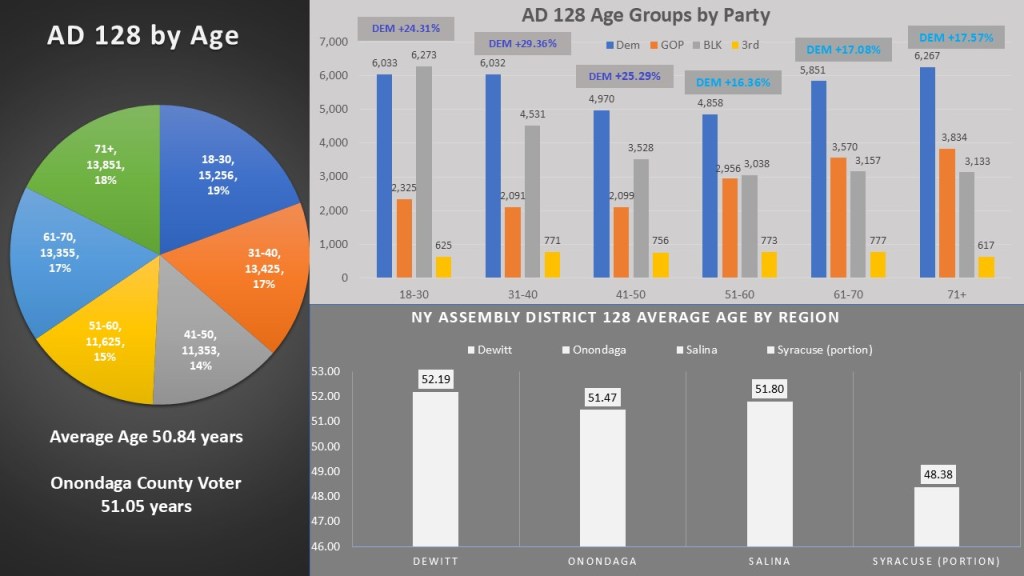
Once again, the fact this district lays entirely inside of Onondaga County I have more tools to use to get a good picture of the district. This year I wanted to look at the age registered voters to get an idea of the differences in different communities. Eagle-eyed readers will see that the average age of Onondaga County has risen a bit to 51.05 years (from 50.87 in March). That is because of the mail checks that I mentioned earlier disproportionally affects the SU Student population and younger population that are more transient and less likely to update their address. This does not mean they will not get to vote if they are still here, they will just have to update their address with us or vote by affidavit. The age groups are typical with an even split amongst the groups and the under 50 groups having a large non-enrolled population as compared to 51+ groups. The differences in ages really come in the Towns and Syracuse portion. All three towns Dewitt (52.19), Salina (51.80) and Onondaga (51.47) are older than the average age of the county and Syracuse portion (48.38) is much younger. This is another way Syracuse exerts its dominance on the district.
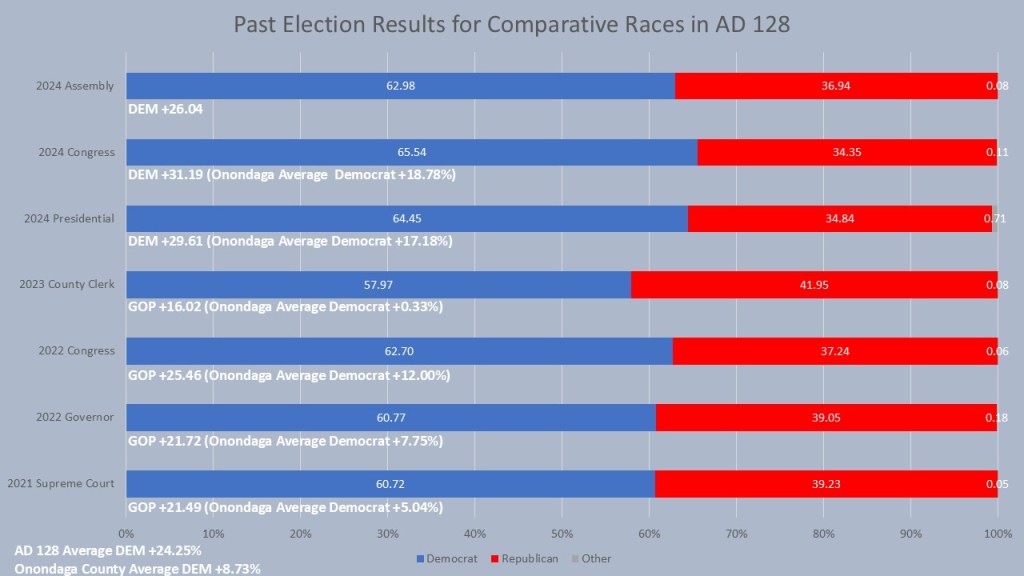
Now that we are back in Onondaga County, I can use our system to look at the comparison races for this year. This gives us an idea of how this district performs in comparison to the rest of the county in similar races. First off, we look at the last result in the district itself in 2024. Pam Hunter won re-election with 26.04% of the vote. This is a little behind where Mannion for Congress (+31.19%) and Kamala Harris (+29.61) ran in the district. In the mid-term year in 2022 Governor Hochul won the district by 21.72% and Fran Canole won the district by 25.46%. This district performs differently in odd years with Emily Essi’s county clerk race only winning the seat by 16.02% and the 2021 Supreme Court race, Brindisi won this district by 21.49%. Still, it is a solidly performing Democratic district the six comparative races the district averaged +25.46% for the Democrats while Onondaga County averaged +8.73% in those races.
That is all for this week’s edition of the #weeklywonk. Next week I will continue my look at the county Assembly districts with AD 129 represented by Bill Magnarelli. Once again, we are on races inside Onondaga County, meaning I can get fresh data, including age data, back into the analysis. As always, you can subscribe to dustinczarny.com for all content and election news updates.
Czarny added that Democrats were gaining in voter registration in almost every town in Onondaga County. Cicero, represented by Tim Burtis, was the one exception, he said.
“Thirty years ago, when I first got involved in politics here, this was a very red county,” said Czarny. “It is not anymore. It is a very light blue, if purple, county.
Still, Czarny added, elections could be surprising. He would not have been able to predict last year’s blue wave in the spring of 2025, and it would be hard to be certain what November could hold.