The Weekly Wonk: New York State 2024

Welcome back to the #weeklywonk. In this space I try to shed some light on the forces that make up the body politic in New York and Onondaga County. Each week I will look at electoral and registration data that make up a political subdivision or an election event. This week I start my look at political subdivisions that will make up the General Election 2024. I start off with a look at New York State as we are electing a US Senator statewide in 2024.

It comes as no surprise that New York is an overwhelmingly Democratic state. When looking at the active voter registration compiled by the New York State Board of Elections in late February 2024 Democrats dominate the active voter rolls. There are 5,778,841 Democrats (49%) in New York. The GOP made up 2,695,185 voters (23%) which is actually third to the non-enrolled at 2,879,809 (24%). The Conservatives have 154,128 voters (1%) and Working Families have 50,048 voters (<1%) and 366,132 voters are enrolled in other various parties (3%). New York is generally thought of in three separate regions. New York City which has 4,519,781 voters (38%), the immediate suburbs consisting of Rockland, Westchester, Nassau, and Suffolk which has 2,835,419 voters (24%, and for lack of a better term upstate New York which has 4,568,943 voters (38%).

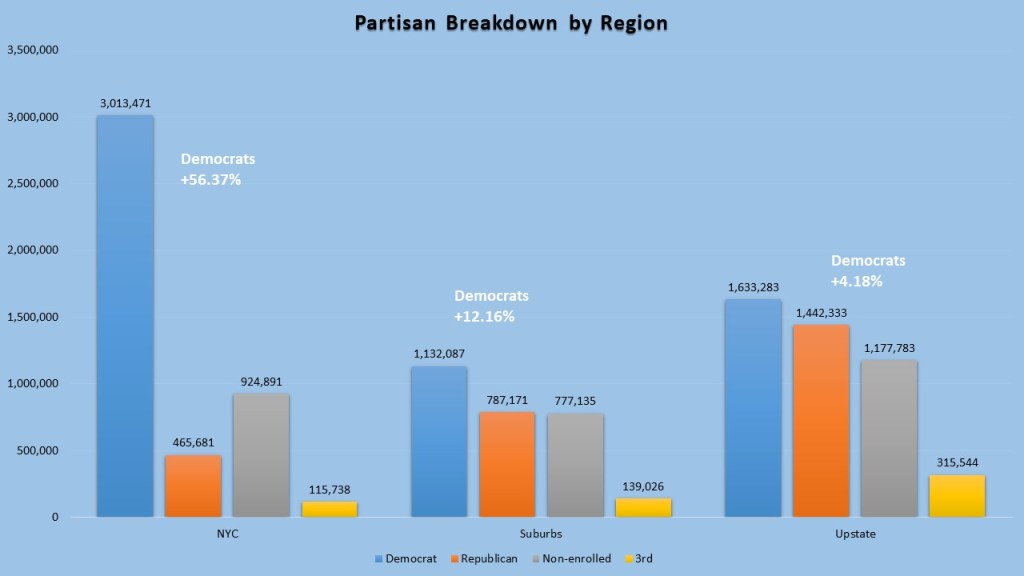
When looking at the partisan breakdown by region Democrats actually are in the lead in all three regions. In NYC Democrats dominate the enrollment there and the GOP are a distant third. Democrats have 3,013,471 voters, non-enrolled 924,891, GOP 465.681 and 115,738 in third parties. That is a +56.37% partisan enrollment advantage for Democrats. In the suburbs of Westchester, Rockland, Nassau, and Suffolk Democrats also have a significant advantage with 1,132,087 Democrats to 787,171, GOP, 777,135 Non-enrolled and 139,026 third parties. That is a Small +4.18% enrollment advantage for Democrats.

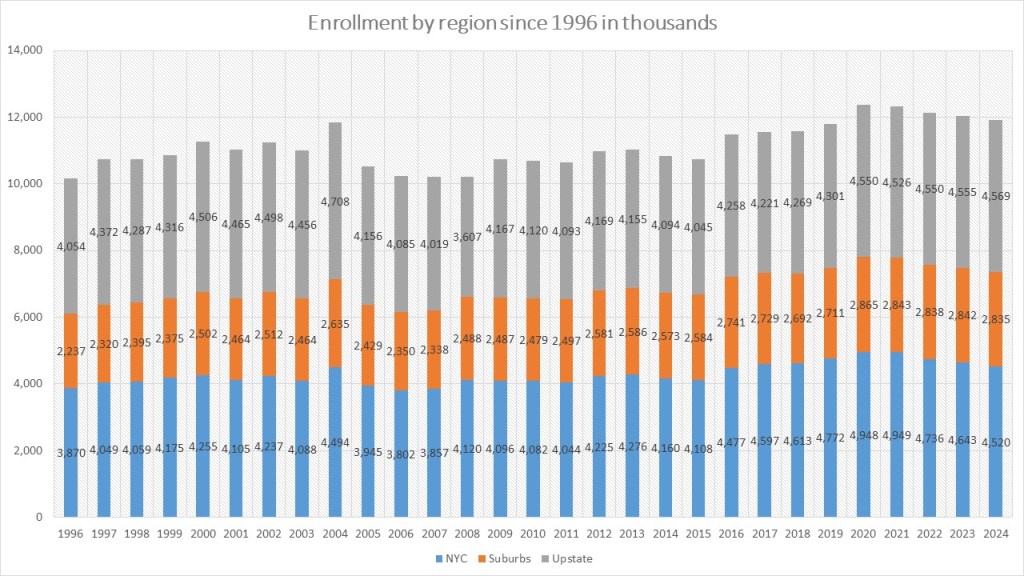
One of the more surprising reveals in this analysis is the upstate region has the most active registered voters, outnumbering New York City. In fact, looking back in registrations going back to 1996, tis is the first 2011 that has been the case. We have seen a steady three-year decline in voter registrations in NYC since 2021 while upstate has gained in that same time period. The suburbs during that time stayed relatively stable. This is not that surprising as urban areas in between presidential elections tend to lose voter registrations and gain in the Presidential year and year after. We will have to check in on the data in November.

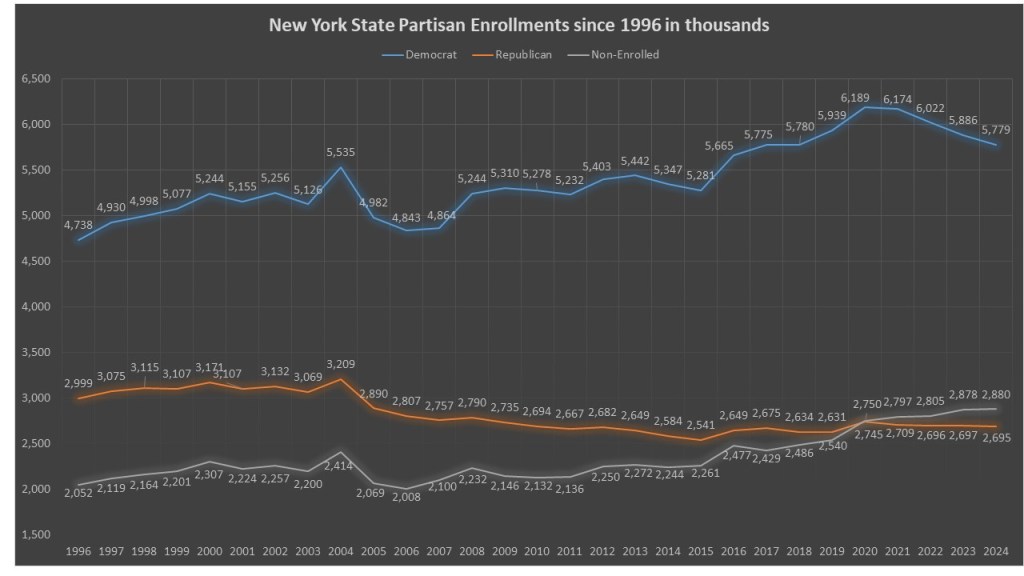
 Another surprising data point is a decrease in Democratic enrollment over the last four years. The Trump presidency supercharged Democratic enrollment in New York, reaching a high of 6.189 million in 2020. Since then, the Democratic enrollment has dropped steadily each year down to 5.779 million in February of 2024. Republicans have not been the main beneficiary though. Their 2.695 million is also part of a steady but smaller decline since 2020. The main benefit seems to be the non-enrolments that have gained second place status in New York climbing to their highest point ever at 2,88 million. Again, the caveat here is the 2024 data is from February and we will have to see if the Presidential election year generates a large enrollment bump.  Also, the Trump years of constant voter registration is an anomaly, looking back at four-year patterns there is usually a drop in between presidential years for major parties and then an increase in enrollment in the presidential year. We could be seeing a natural dip that will be erased by the end of the year.

When looking at how New York votes in common elections I have decided to look at 5 different statewide elections. The first of course in Gillibrand’s 2018 re-election bid since she is up for re-election again. She crashed in that election winning 64.90%. Since it is a presidential election, I take a look at the 2020 US Presidential result. President Joe Biden carried New York with 60.35%. Most statewide elections happen in mid-term years. In 2022 We elected an all-Democratic slate for statewide office which has happened each midterm since 2006. However, it was one of the years the GOP did the best. Senator Schumer (55.66%) won by double digits. However. Attorney General Letitia James had just 53.14% of the vote and Hochul just 52.67% of the vote.

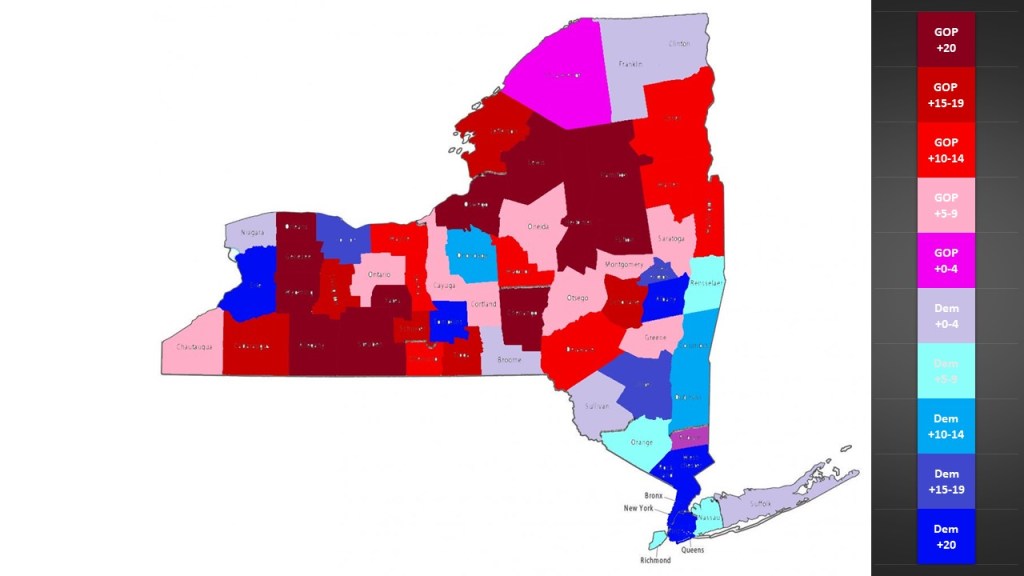
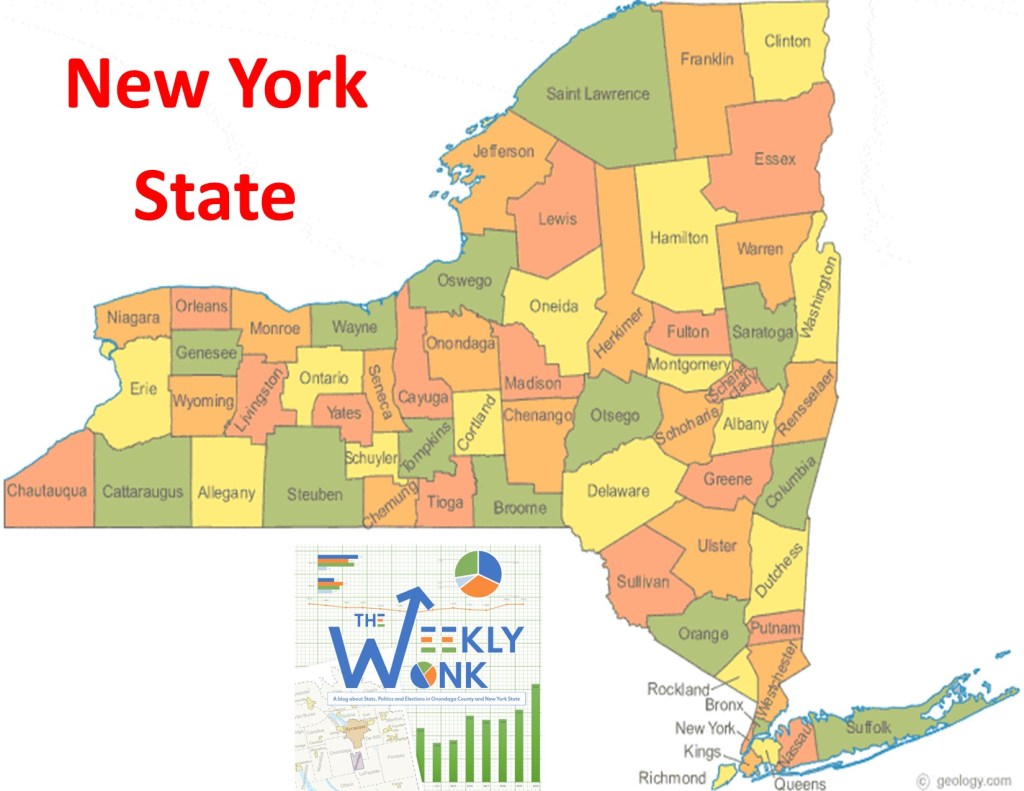
Finally, it is the return of the heat map. While for efficiency sakes I broke the whole of New York into three regions, we can see by the heat map that individual counties that make up those regions show the vast diversity of New York as a whole. NYC is a dominant blue, but Richmond County (Staten Island) is a standout of slightly less Democratic enrollment. The suburbs are truly broken into two different regions of the northern suburbs of Rockland and Westchester which are heavily Democratic and Long Island counties of Nassau and Suffolk that are borderline Democratic at best. Upstate sees the most diversity of any region. The Hudson valley region of Ulster, Orange, Dutchess, Sullivan, Putnam, and Columbia counties have either borderline to solid Democratic counties. The Capital region of Albany, Schenectady and Rensselaer also show strong Democratic enrollment. Counties with large urban cores such as Onondaga (Syracuse), Monroe (Rochester) and Erie & (Buffalo) also show solid to large Democratic advantages. Finally, some smaller counties with large college populations like Tompkins, Broome, Franklin, and Clinton show areas that have borderline to strong Democratic leanings.

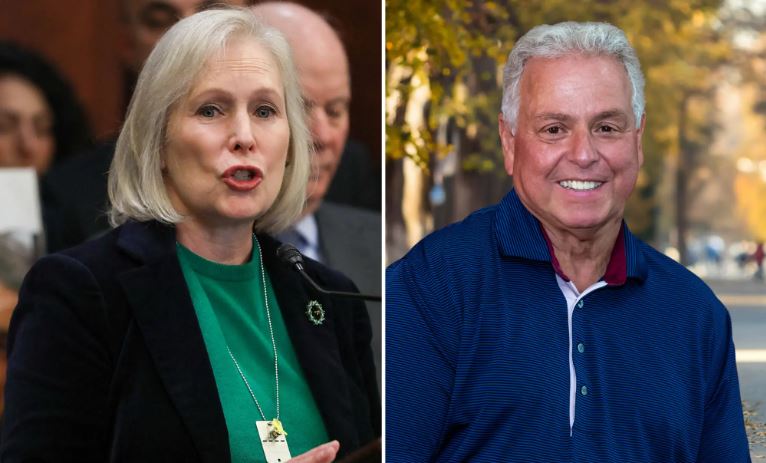
As mentioned at the top of the article, we do have a choice for US Senate this year in New York. Senator Kristen Gillibrand is running for re-election. She became Senator in 2009 appointed by Governor Patterson to fill the term of Hillary Clinton. She won a special election in 2010 to fill out the remainder of the term and re-election bids in 2012 and 2018. She is facing Republican and Conservative Michael Sapraicone. As of this article there are several candidates who filed petitions to create primaries on the Democrat and GOP side for US Senate, but they have all been preliminarily ruled invalid by the NYS Board of Elections and will need to go to court to preserve their right to challenge but that is considered unlikely.


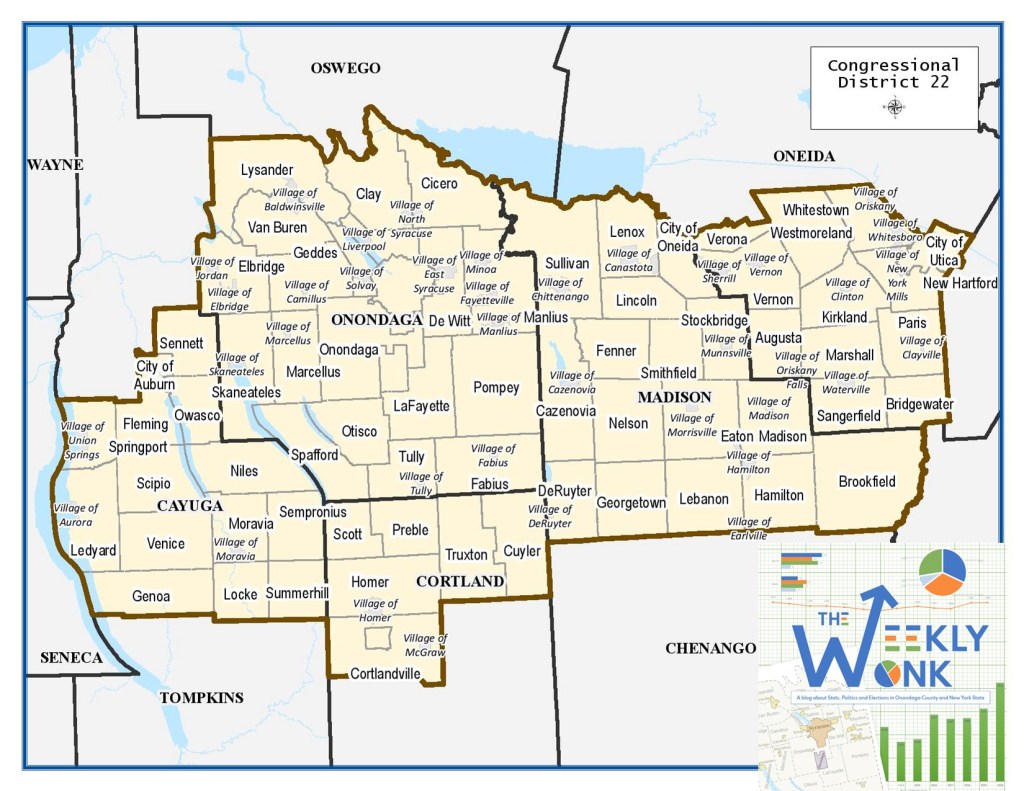
That is, it for this week’s edition of the #weeklywonk. Next week I will take a look at the newly drawn New York 22nd Congressional district. I will look at the changes in this district since the last election and redistricting’s effect in the district. As always you can subscribe to dustinczarny.com to get all content and election news updates.

Zoom with Czarny: Onondaga County Comptroller Martin Masterpole

This week I sit down with Onondaga County Comptroller Martin Masterpole. In our annual chat we talk about the state of Onondaga County. As the top elected Democrat we talk about his goals for his second term. Enjoy.

Subscribe to dustinczarny.com for all content and election news updates

Commissioner in a Car: What’s in the NY Budget for elections?

In this week’s edition I talk about the Poll Book Replacement Grant ($14.7m), Postage Grant ($7.7m) and Aid to Localities ($5m). for local county boards and funding for the Public Campaign Finance System and NY Voting database in the 24-25 NY budget. Enjoy.

Subscribe to dustinczarny.com for all content and election news updates

The Weekly Wonk: Election Day and Overall Turnout 2024 Presidential Primary

Welcome back to the #weeklywonk. Each week I investigate a political subdivision or election result here in Onondaga County and sometimes beyond. I analyze electoral and registration data to illuminate how voters are behaving and interacting with our Democracy. This week I finish my two parts looking back at the April 2nd Presidential Primary. Today I will look at the Election Day and Overall turnout and how voters in Onondaga County interacted with our electoral process.

There were 11,415 ballots cast in the 2024 Presidential Primary in Onondaga County. 7,672 ballots were cast on Election Day (67%). 2,469 ballots were cast by Mail Balloting (22%). 1,201 ballots were cast by Early Voting (10%). Seventy-two ballots were cast by Affidavit voting (1%) and one ballot was cast as part of a court order (0%). Of the Election Day ballots cast 4,220 ballots were casting the Democratic Primary (55%) as compared to 3,453 ballots cast in the Republican primary (45%).

It is hard to compare primaries to each other as each primary election has a distinct set of eligible voters. The two primaries that are most similar to this year’s Presidential Primary is the dual set of primaries in June (Governor) and August (Congressional) of 2022 where both the Democrats and Republicans have choices countywide. Compared to them the 2024 Presidential primary had approximately a third of the raw voters of both of those primaries (23,272 June 2022and 26,492 August 2022). When you look at the percentage of the overall vote you can compare elections better. Only 67.19% of the voters who participated in the 2024 Presidential Primary decided to wait till Election Day. This is the lowest since the 2020 combined June primary and part of a four-election downward trend.

We had a reduced number of polling places for the 2024 Presidential Primary as we tried to get out of schools who were in scheduled session for April due to the expected low voter turnout and lack of competitiveness in the election. That meant that certain polling places had a larger volume of voters than normal because of this. Almost all Polling places in our top ten were combined with other polling places for that purpose. In fact, only three of the polling places, Bishop Ludden, Eagle Hill Middle School, and Dewitt town Hall were not combined polling places, two of them being schools we were not able to consolidate with the others.

One of the great additional data sets we have been able to get with the addition of electronic poll books is to be able to measure votes cast by hour. The 2024 Presidential Primary election followed a typical low turnout election. A slow but steady increase throughout the day till 3pm. Then we see a three hour after work dinner hour bump in activity. Then a sharp and steady decline until the end of voting at 9pm. Higher turnout primaries like the dual 2022 primaries have peaks in the morning as more voters are excited to vote and then a drop off till the dinner rush.

As hinted at last week and earlier in this article, this was an extremely low voter turnout election. The 11417 voters represented just 4% of the registered voters of Onondaga County. An additional 107,678 (35%) voters were in-eligible to cast a ballot in the Presidential Election decided not to vote. Another 186,358 voters (61%) were eligible but decided not to participate. Of the eligible voters we only saw a 5.78% turnout. When looking at the turnout in the parties, 5,026 of the turnouts was Democrats (57%) and 3,853 was GOP (43%. Voter turnout rates were both pathetically low. Democrats turned out at 5.79% and the GOP turned out at 5.62%.

Unlike in General elections, Democrats are usually more enthusiastic to vote in primaries. However, in the last three primaries the GOP voters were more enthusiastic in similar primaries. Democratic turnout this primary was slightly more enthusiastic but only by a whisker. Still, we do see that we are in a 5-year stretch of more frequent primaries for both. t.  as competition among intra party factions continues.

Finally, when looking at the regional turnout, the 2024 Presidential Primary acted in an unusual way compared to other primaries and elections in general. Normally we see that turnout in the suburbs is higher than in the City of Syracuse. In 2024 April Primary the City of Syracuse eligible voters turned out at a 5.86% rate, slightly higher than the suburbs 5.76%. While it is more frequent to see this in primaries than general elections, it is usually in elections were there are Democratic primaries that dominate the turnout as the City of Syracuse is overall very Democrat.

That is all for this week’s edition of the #weeklywonk. Next week I will start to turn my attention to the political subdivisions that make up the 2024 General Election. I start with a look at New York State as a whole as we have a statewide election for United States Senator. As always you can subscribe to dustinczarny.com for all content and election news updates.

Zoom With Czarny: Syracuse City Auditor Alexander Marion

This week’s Zoom with Czarny I interview Syracuse City Auditor Alexander Marion about his first 100 days in office. We talk about his vision to use his position to better the City of Syracuse and change how people think of the City Auditor. It is a day late so we could get some NYS budget news for elections as well. Enjoy.

Subscribe to dustinczarny.com for all content and election news updates

Commissioner in a Car: Petition and Budget updates.

This week I do updates on petition challenges that might effect the 2024 June primary for SD 50 and CD 22. I also talk about rumors of what is in the NYS budget for elections. As always go to dustinczarny.com for all content and election news updates.

Subscribe to dustinczarny.com for all content and election news updates

How will changes in state voting laws and procedures affect 2024 constituency? – Oswego Now

“A lot of Republican-led states use that rhetoric to go out and try to get people to change their voting laws to actually impact student communities, urban communities, and people who want to vote in alternative methods.” 

While many states are making it more difficult to vote, there are also many laws that limit voter registration as well. Fifteen states have new voter registration laws making it more difficult to register and stay registered, as well as tighter ID laws. 

“It’s problematic. I think every governmental entity should be geared towards trying to get as many people voting as possible as opposed to as few,” said Czarny. 

The Weekly Wonk: Alternative Voting in the April 2nd Presidential Primary

Welcome back to the #weeklywonk.  Each week I investigate a political subdivision or election result here in Onondaag County and sometimes beyond.  I analyze electoral and registration data to illuminate how voters are behaving and interacting with our Democracy.  This week I start my two parts look back at the April 2nd Presidential Primary.  I start off by looking at alternative voting methods, Early, Absentee, and Affidavits and how voters used these methods this last election.

In the 2024 Presidential election we had 1208 voter check-ins during the Early Voting Period.  The April 2nd Presidential Primary only had two parties involved, Democrat and Republican.  808 (67%) of the Early Voters are Democrat while 400 (33%) were Republican.  We opened 8 sites for the Presidential Primary on April 2nd.  The number of sites we open is dependent on the number of eligible voters for the primary, 1 for every 30k voters.  There were nearly 200k eligible voters mandated at least 7 sites, and we opened 8.  The reason for that is we were forced to make the decision on February 16th when other states were showing record turnout.  Of the 8 sites opened they fell into 3 levels of activity. 

Dewitt Town Hall (296 25%) was the largest turnout as usual, followed by Clay Town Hall (253 21%) which made up the heaviest usage.  The next four sites were all Moderate usage:  Armond Magnarelli (163 13%), Camillus Fire Department (133 11%), OCC Mulroy Hall (110 9%), & Lysander Municipal Building (103 9%).  The smallest sites once again belonged to Beauchamp Library (75 6%) and Lafayette Fire Station (70 6%).  Dewitt Town Hall and Clay town hall continue their ranks over the years of being top sites when they are selected as sites for primaries.  Beauchamp and Lafayette Continue to be the lowest performing over the years.  However, site performance is not the only reason to select a site, Lafayette Fire Station services voters in the southern part of the county and Beauchamp in the inner city.

Early Voting took a bit of a hit this primary in terms of raw voters and percentage of the overall vote.  Primaries are imperfect elections to compare to each other in the raw vote totals.  There are different numbers of eligible voters for each primary.  In the 2024 Primary all GOP and Democratic voters were eligible.  The best comparisons are the two primaries from 2022.  1208 Early Voters in 2024 compared to 2761 in June of 2022 and 4154 UN August of 2022 shows what a low turnout election this was.  However usually even in low turnout over the last five primaries we had seen usage of Early Voting grow in terms of percentage of overall vote.  However, 2024 we saw that percentage dip to just 10.58%, the lowest since 2021. There are clues as to why this was the case later in this article.

When we look at a comparison of parties that used Early Voting, we can see that Democrats continue to use this alternative voting method at a greater rate. There are more Democrats that Republicans in Onondaga County, so we expect them to outnumber the GOP, however they also are voting at a greater rate.  When we look at percentage of the overall voter population in 2024 .7% of the Democrats showed up to Early Vote, while .49% of the GOP did.  When looking at the percentage of the voters that chose to vote Democrats led the GOP 12.06% to 8.48%.  However, the gap does appear to have closed in the last few primaries and that may be because the anti-Early Vote rhetoric is not as prevalent in the GOP side during a primary as opposed to General Elections.

As we look to mail voting there is an interesting story to tell.  There are new options for voters when it comes to voting by mail this year, starting with this primary.  There is an Early Vote by mail option which eliminates the excuses that absentee voting requires.  However absentee voting is still an option as it is a permanent option for every election as opposed to EVBM which must be selected each year.  In purpose of reporting and tabulating they are done together in our system as Mail in voting.  We issued 5216 mail ballots for the 2024 primary.  2483 were successfully cast &2733 were never returned. 342 ballots were returned undeliverable to the address on file and an additional 40 were rued invalid. Of the 40 ruled invalid 35 were because the postmark was after Election Day, 3 were because the voter wanted to cancel the ballot after returning, 1 because they voted in person at a polling place, and 1 because they voted affidavit. Of the 2483 successfully returned ballots Democrats had 1638 (66%) and the Republicans had 845 (34%).

When looking at mail balloting by year in terms of raw numbers it is comparable to the two previous similar primaries in 2022.  2483 ballots returned out of 5214 ballots requested is like 2022 June (2628/4944) and August (3069/5824).  However, where this primary stands out is the percentage of the overall vote that was cast by mail.  The 2024 primary had 21.69% of the overall ballots cast were cast by mail.  This is the highest percentage since the record of June 2020 in the middle of the pandemic which saw 69.96% of the ballots cast by mail.  There are several reasons why this occurred.  The EVBM option made it easier to chose mail in balloting.  The postage paid option removed a barrier to casting ballots.  However, the biggest reason may be that when mail ballots were sent out in mid-February the Presidential primary still had active candidates on both sides of the aisle.  Nikki Haley and Dean Phillips pulled out after the Super Tuesday contests in early March which made the April 2nd primary in New York fait accompli.  This made Early Voting and Election Day turnout smaller than normally expected increasing the returned absentee influence on the election.

The last form of alternative voting is voting by affidavit balloting.  Affidavits are cast by voters who are not listed as active voters at their current address when they show up in person to Early or Election Day.  In the 2024 Presidential primary we had 72 voters who voted by Affidavit.  54 ballots were ruled valid:  22 were voters that changed their address, 14 were voters who applied for but did not return a mail ballot, 8 were voters classified as Inactive, 4 were CBOE transfers from other counties, and 1 a name change.  Of the 72 Affidavit ballots 39 were Democrat, 19 Republican, and 14 were of voters by another party.  Since New York is a closed party state, all non-Democrat and non-Republican affidavits were rejected, and the voters properly registered for future elections.  In addition, 1 voter had already returned a mail in ballot and 1 voter returned an affidavit envelop with no ballot.  That means 77.78% of all affidavit voters had their ballots accepted and counted. 

That is all for this week’s edition of the #weeklywonk.  Next week I will conclude my look back at the April 2 Presidential Primary with a look at Election Day and overall turnout.  As always you can subscribe to dustinczarny.com for all content and election news updates.

Zoom with Czarny: Karen Wharton of Citizen Action

This week I speak with Karen Wharton of Citizen Action of New York. We have a great conversation about the work she is doing centered around the new public campaign finance system and other initiatives in New York. Enjoy.

Subscribe to dustinczarny.com for all content and election news updates

Commissioner in a Car: Designating petitions are in, here is what we know.

This week I talk about the end of the designating petition filing window. We know we have Democratic primaries in NY 22 and SSD 50 and GOP primaries in SD 48. I also go into what are the competitive races for this fall’s elections as well. Enjoy.

Subscribe to dustinczarny.com for all content and election news updates