I had a great time appearing on CitrusTV talking about local elections and why young voters ahoukd participate this year, check it out.
Zoom with Czarny: Skaneateles Town Candidates
This week I sit down with Skaneateles Democratic Committee candidates for the fall election: Chris Legg Skaneateles for Town Supervisor and Ralph Demasi for Skaneateles Town Justice. Skaneateles is my alma matter and I am proud to bring you this conversation. Enjoy.
Learn more https://www.skaneatelesdemocrats.com/take-action
Subscribe to Dustinczarny.com for all content and election news updates
Board of Elections likely to go over budget in busy 2024 – WAER
“We’ve given them this data. I stand by our data,” Czarny said. “It’s backed up by the New York State Board of Elections. It’s backed up by New York State election law.”
He says, for example, that election law tells them how many inspectors they need per election district.
“This is a math issue. It’s not a subjective issue,” Czarny said. “So if they gave us more money than this year, great. It’s a presidential year next year. We have three elections next year, not two, and we have 76 percent turnout instead of 40 percent turnout.”
https://www.waer.org/news/2023-10-11/board-of-elections-likely-to-go-over-budget-in-busy-2024
Commissioner in a Car: Election deadlines and BOE Budget woes
Today I talk about the upcoming deadlines for the General Election. I go over Absentee, Early Voting, and Registration deadlines. I also respond to the passage of the Onondaga County budget and the shortfall for the Board of Elections in 2024. I also directly respond to some of the criticism brought on the County legislature floor today. Enjoy.
Subscribe to dustinczarny.com for all content and election news updates
The Weekly Wonk: Onondaga County Legislative District #10

Welcome back to #WeeklyWonk. Each weekend I publish an article on a subject relating to elections in Onondaga County and New York State. Often these articles will have detailed stats to consume but sometimes they will be a recap of a prominent issue or on relevant election law. I am turning my eye to the 2023 elections. Today this series turns away from the towns of Onondaga County and to the Onondaga County Legislative districts that have competitive races. This week I investigate Onondaga County Legislative district 10.
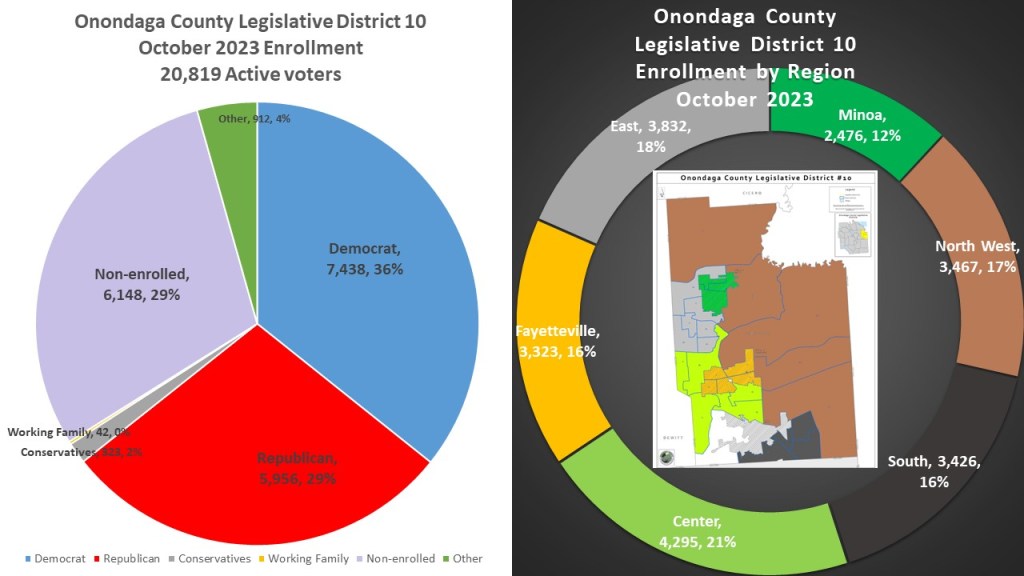
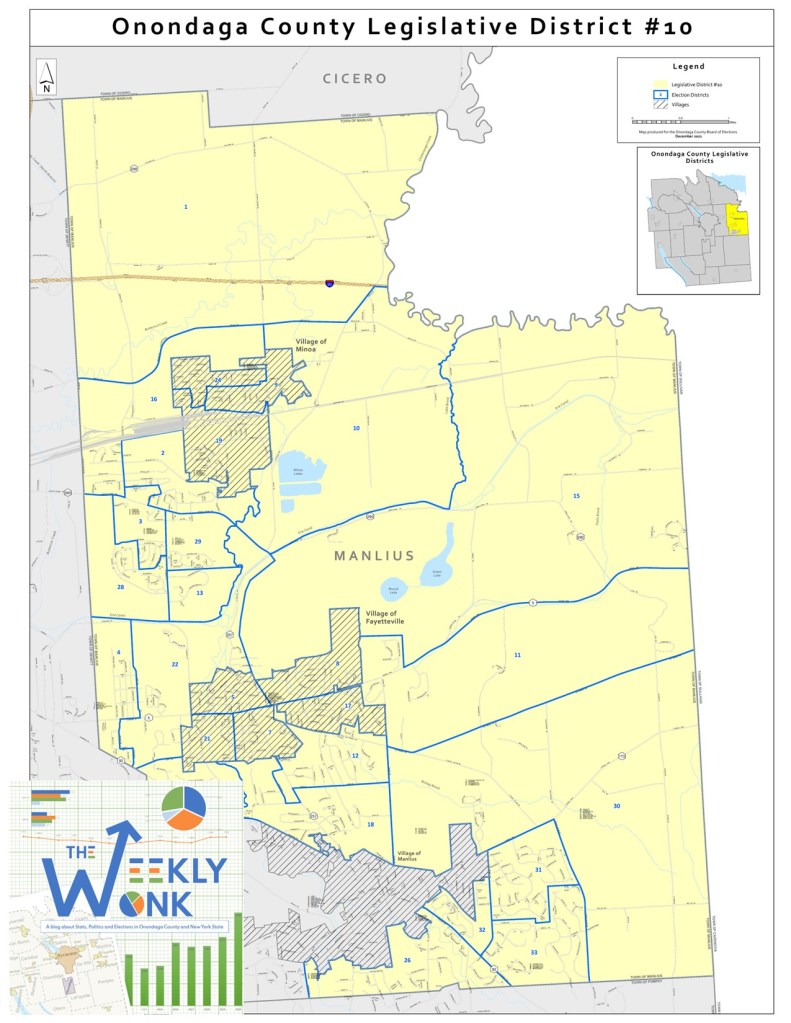
OCL 10 has been known as the Manlius district for decades. For most of its existence it made up the three villages and southern 2/3rds of Manlius. However, during redistricting the village of Manlius and southeast corner was removed and the district was shifted to the northwestern two thirds. It was also necessarily reduced in size as it as Manlius as a whole has grown faster than the rest of Onondaga County. This made the current makeup of OCL 10 slightly smaller and slightly more Republican than before with 20,819 active voters. The partisan breakdown is 36% Democrat (7,438 Voters), 29% GOP (5,956 Voters), and 29% non-enrolled (6,148 voters). OCL 10 is made up of six distinct regions for the purpose of my article. The two villages Minoa (2,476 voters, 12%) and Fayetteville (3,323 voters 16%). The other four regions are made up of regionally grouped election districts. The Northwest portion borders Cicero and Madison County (3,467 voters 17%). The Northeastern portion is between Minoa and the Town of Dewitt (3,832 voters 18%). The Center portion is between Fayetteville and the Town of Dewitt (4,295 voters 21%). Finally, the Southern portion borders the Town of Pompey and west of the village of Manlius (3,426 16%).
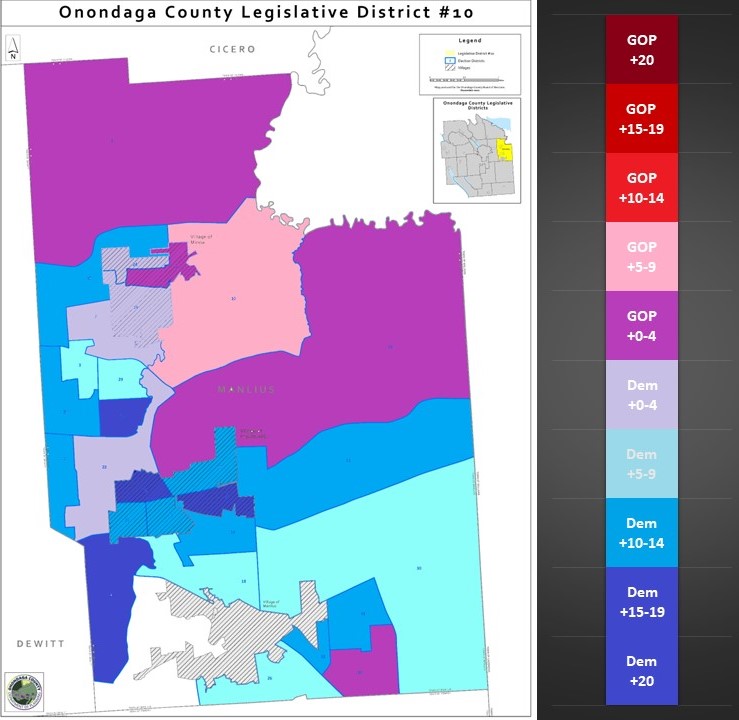
In a new feature I am bringing to the #weeklywonk this year I am doing a heat map for each political subdivision. I will be looking at the current partisan makeup of each individual ED and heat mapping its partisan lean based on the advantage for the democrats and GOP. Looking at the heat map we really see that OCL 10 has is mostly made of democratic and democratic leaning election districts with republican leaning districts in Minoa and the Northwest portion of Manlius. Only 1 election district has a slight Republican lean, ED 10 (GOP +5-9%). Four more eds, 1, 9, 15, 33 are borderline Republican (GOP 0-4%). Five eds, 2, 19, 22, 24, and 20 are borderline Democrat (DEM 0-4%). Six eds, 3, 11, 12, 18, 26 & 29 are slightly Democratic (DEM 5-9%). Eight eds 4, 7, 8, 13, 16, 28, 31, & 32 are moderately Democratic (DEM 10-14%). Finally, four eds 5, 6, 17, & 21 have strong Democratic leans (DEM 15-19%).
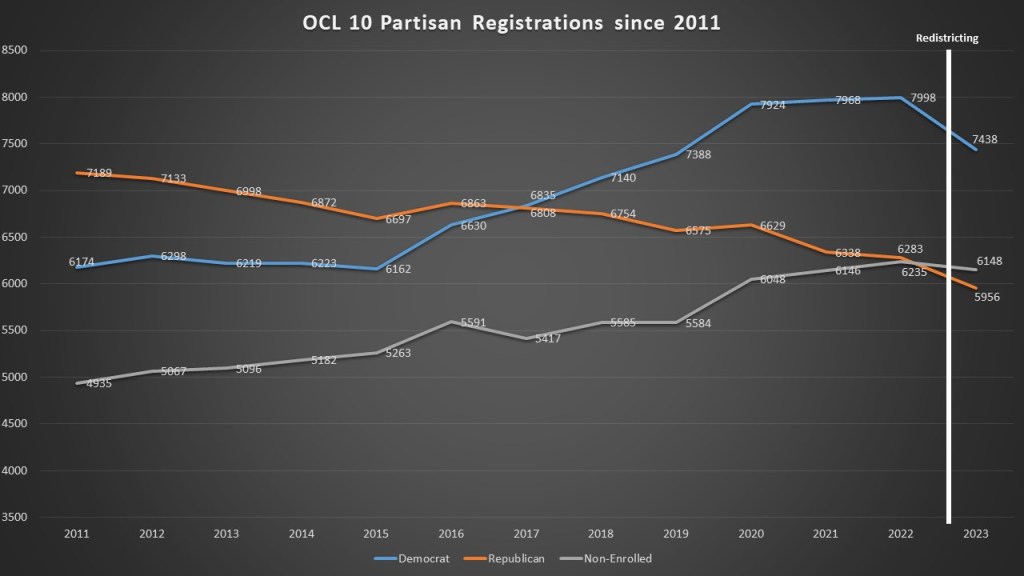
OCL 1, much like the Town of Manlius as a whole, has flipped in terms of registration over the last decade. Like many suburban communities Democrats and Non-Enrolled have grown the registrations while the GOP has lost significantly. Republicans lost 1,233voters, Democrats gained 1,264 voters, and the non-enrolled gained 1,213 voters from 2011-2022. Though the redistricting plan was passed by the legislature and county executive in 2021, the lines did not go into effect until the 2023 elections. With the new lines in place, we see an attempt to try and slow the growth of Democratic voters by shifting the populace slightly more GOP, though all parties’ lost voters. The GOP lost 327 voters, the Democrats lost 560 voters, and the n/e lost 87 voters. However, this redistricting did for the first time put more non-enrolled voters in the district that Republican which is usually a good sign for Democratic candidates.
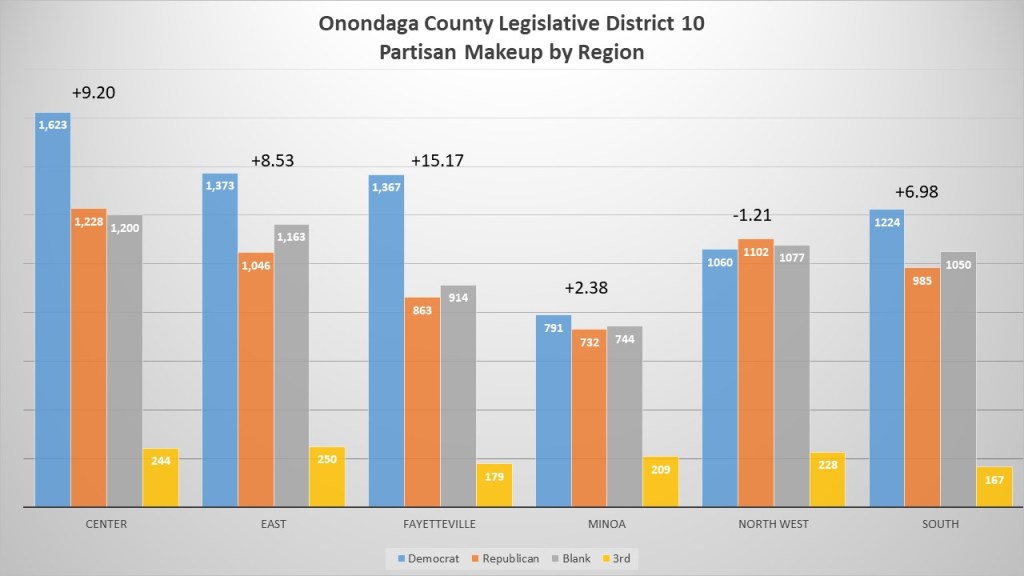
Five of the six regions of Onondaga County Legislative District 10 tend to lean Democratic. The most Democratic region is the village of Fayetteville with a strong Democratic lean of +15.17. This is followed by the center region with a +9.20 slight Democratic lean. The east region is a close third with a +8.53 slight Democratic lean. The southern region is fourth with a +6.98 slight Democratic lean. The Village of Minoa is basically evenly split with a borderline +2.38 Democratic lean. The only region with a GOP lean, although borderline one, is the Northwest with -1.21 GOP lean.
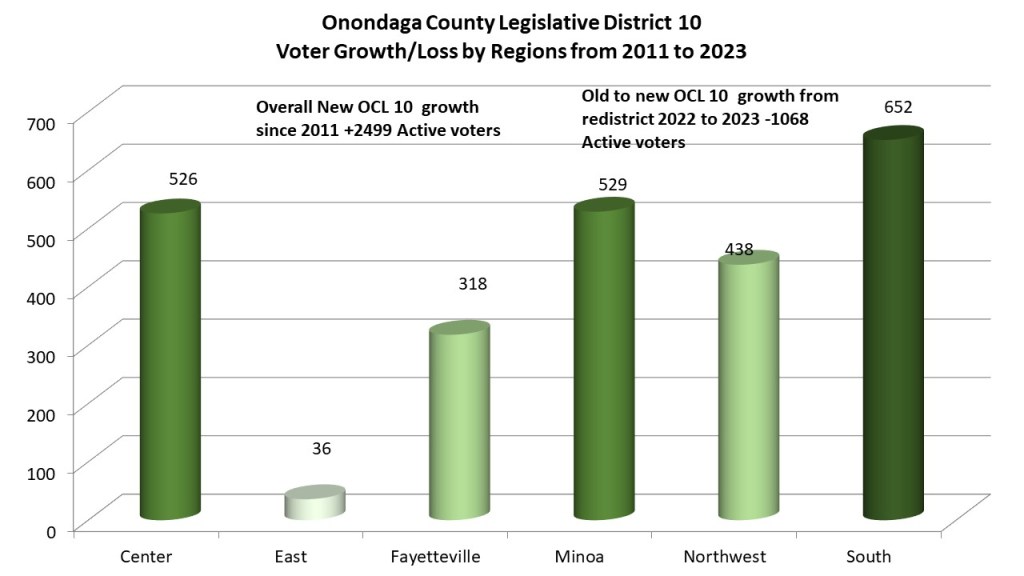
Looking at the growth of voters since the last redistricting cycle we compare it with the data from right before redistricting of 2011. The largest growth came in the Center region (+652 voters). This was followed by the eds making up the village of Minoa (+529 voters). The center region grew at a similar rate (+526 voters). This is followed by the Northwest region growth (+428 voters). The village of Fayetteville grew by +318 voters. The east eds grew the least by +36 voters. One of the reasons the Minoa eds grew and the East did not grow as much is the Onondaga County Board of Elections altered the eds moving voters out of the East region and into the village of Minoa. Because the district was forced to shrink during redistricting it lost 1,68 voters between 2022 and 2023.
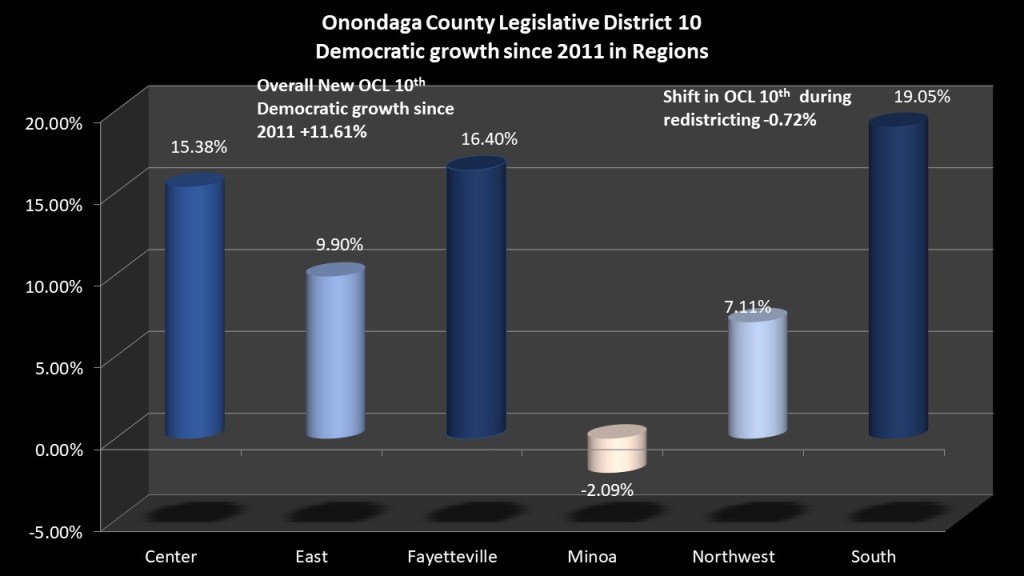
Redistricting really makes looking at the long-term Democratic trend slightly troublesome, however the makeup of this district did not change much. If we just look at the eds that are in the new district the current version of OCL 10 grew 11.61% more Democratic since 2012. The biggest Democratic gains came in the southern region with a phenomenal +19.90% gain. This is followed by Fayetteville with a +16.40% gain. Then the Center with + 15.38%. The East grew by +9.90%. Even the republican friendly portion of the district, the Northwest had a significant +7.11% Democratic gain. Only the village of Minoa actually had a GOP gain, with +2.09% going to the GOP. However, despite the shift north the GOP only gained 0.72% registration shift towards the GOP.
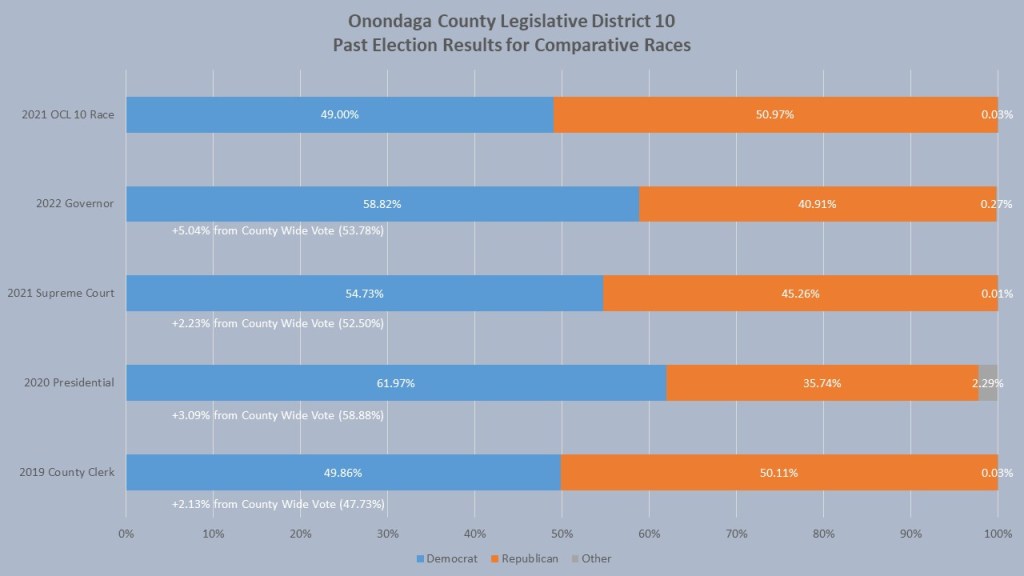
Unfortunately, when we look at the comparative races, we can only run numbers at the OCBOE for the old district when the races all happened. With the GOP only gaining 0.72% in redistricting, we could see similar results in future years. The old OCL 10 district performed consistently 2-5% better than Onondaga County as a whole, which makes it as close to a representative district as possible. In 2022 Governor Hochul won this district with 58.82% of the vote, 5.04 more than her totals in Onondaga County. In 2021 Anthony Brindisi won this district with 54.73% of the vote in his race for Supreme Court, 2.23% ahead of his totals in Onondaga County. In 2020 President Biden won this district with 61.97% of the vote, 3.09% ahead of his win total in Onondaga County. In 2019 Mark Kolinski barely lost this district with 49.86% of the vote, 2.13% ahead of his total in Onondaga County. In 2021 Mark Olsen won election to this district by just a 1.97% margin. The district has been one of the closest elections in each of the last 3 cycles and will.

Challenging Mark Olsen to flip this district is first time candidate Carrie Wood. Manlius as a whole is coming off a big special election that pitted the Democrats against the GOP and the Democrats once again came out victorious. Carrie is hoping to ride that momentum and the success of the Manlius Democratic Committee to flip this seat blue. Check her out here: https://www.facebook.com/profile.php?id=100089957784722.
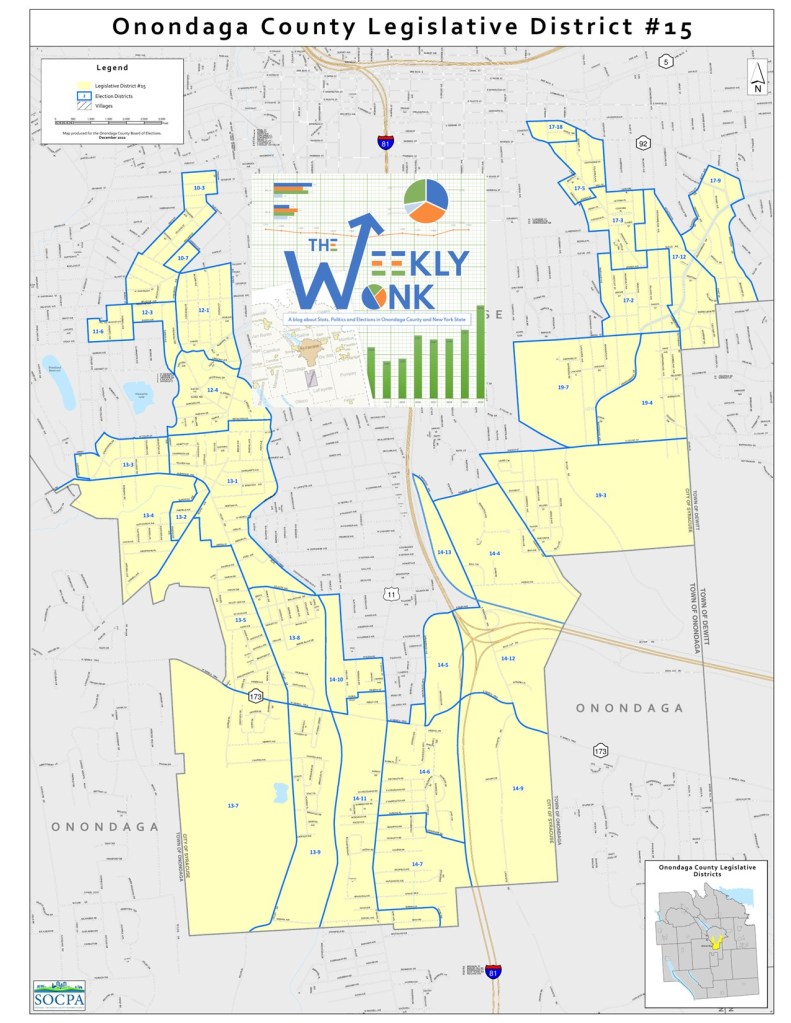
That is, it for this week’s edition of the #WeeklyWonk. I have finished my investigations into the Towns of Onondaga County. I have now turned my attention to the competitive seats for the Onondaga County legislature. With only 5 seats in contention this will take me close to Election Day when I will take another look at Onondaga County and the City of Syracuse. Next week I will investigate Onondaga County Legislative District 15, which had a major transformation making it a city only district in 2023. As always you can subscribe to dustinczarny.com for all content and election news updates.
Zoom with Czarny: Village of Solvay Democratic candidates
This week i talk tot he Democratic candidates for the village of Solvay: Joseph Miczan, Charles Orr, and Deborah DeGilio. We talk about the unique nature of Solvay the largest village in Onondaga County.
/
Subscribe to dustinczarny.com for all content and election news updates
2024 Budget testimony by the Onondaga County Board of Elections
(I always release testimony given to official public bodies on my website. On September 15th, 2023 Commissioner Sardo and I submitted this testimony in writing as we were not afforded a budget hearing at the Onondaga County Legislature outlining some of the shortcomings of the Executive budget proposal for the 2024 Onondaga County Board of Elections budget. Negotiations are ongoing and the legislature at this time has not finalized the budget, but I wanted to release this testimony now for transparencies’ sake.)
Joint 2024 Budget Statement by Commissioner Czarny and Sardo
Onondaga County Board of Elections
2024 Executive Budget
September 15, 2023
After reviewing the 2024 Executive budget for the Department of the Board of Elections, we would like to communicate our concerns towards the budget reductions. It was expressed to us that the figures derived were the result of simulating the 10% increase between 2016 and 2020 actual spending. Elections have changed radically in 2019 with the advent of Early Voting. They further changed in 2021 with expanded early voting and full day statewide primaries. Much of the 2020 spending was diverted to grant spending like HAVA, ITC, and the Federal CARES act, none of which is available this year.
Reductions to the 103 Budget line.
2020 only had one consolidated primary, as the Presidential Primary was moved and combined with the June Primary. In 2020, Primary Election Day hours were 12pm to 9pm. By state law, the hours required for all primaries are 6am to 9pm. This means that in 2020 we had to field Election Day inspectors for only 28 hours (11 for the June combined primary and 17 for the November General Election). In 2024, with two full day primaries and a general election at 17 hours a piece that is a total of 51 hours of Election Day funding. That is an 80% increase from 2020. This is a mandatory expense.
In 2020, we were only mandated to have 6 early voting sites for a total of 78 hours of operation per site (10 hours on all 5 weekdays and 7 hours on each of the 4 weekend days). That is a total of 468 staffed early voting hours per election. In 2020, we only had two elections, totaling 936 staffed early voting hours. In 2024, we will be mandated to have 10 sites for all three elections instead of 6 sites. In addition, all 9 days of early voting will be 10-hour shifts for the inspectors for a total of 90 hours per site. That is 900 staffed early voting hours per election. With 3 elections in 2024, that is a total of 2,700 hours of staffed early voting hours. That is a 188% increase from 2020. This is a mandatory expense.
In 2020, we paid inspectors $12 per hour. In 2024, we pay them $15 per hour per New York State minimum wage requirement. That is a 25% increase from 2020. This is a mandatory expense.
In 2020, we paid our inspectors a flat fee of $25 per training class. Since then, the county and IRS has designated the inspectors as employees and not contract workers. This not only meant we must pay them minimum wage for their mandatory yearly certification class, but we also had to include an additional instructional hour dedicated to mandatory sexual harassment training. This resulted in a 3.5-hour certification class in which an inspector will be paid $52.50. That is a 110% increase from 2020. This is a mandatory expense.
In 2020, we only had to bring in the Machine Technicians to perform mandatory logic and accuracy testing and work 2 election days. 2024 will require the same work for all three elections. That is a 33% increase from 2020. This is a mandatory expense.
Attempt by Board of Elections to save on costs.
We have attached an updated spreadsheet with our requirements for the 103 budget line. It details the number of inspectors for each polling place needed, training costs, early voting costs, and costs for the Machine Technicians who are brought in each election to supervise polling places and perform maintenance on the voting equipment. After careful re-examining and detailing the need of this department based on the most up to date information, we have identified some potential savings.
We are cognizant that increased stipulations to the county and the lack of grant funding is a significant burden to the county. That is why the commissioners have used technology to significantly reduce the number of inspectors we deploy. Here is how:
NYS Election Law 3-400 requires the deployment of 4 election inspectors for every election district in the county. We have 436 election districts in Onondaga County. This would require the deployment 1,744 election inspectors. If we held to that plan for all three elections, it would cost the county almost $1.9 million on the 103 budget line. A link to that election law is provided below:
https://www.nysenate.gov/legislation/laws/ELN/3-400
The Onondaga County Board of Elections has used technology and alternative staffing plans for the primary and general elections that significantly reduce our inspector deployment. We also have reduced our inspector deployment from nearly 1,500 inspectors in 2016 to a proposed 1,220 inspectors in the General Election of 2024. We have already reduced polling places (-30 from 2019) and Machine Technicians (down from 26 to 24) in hopes of operating more efficiently as well. All of this was done as voter enrollment has grown from 285k to approximately 305k.
By introducing Clearballot systems, we feel secure in reducing the number of inspectors needed to deploy. However, the definitive news that minimum wage will rise to $15/hr. tapped down our hopes for larger savings. Still, we were able to lower our request by over $50k to $1,646,873.25.
Reductions to the 101 and 102 lines
Finally, we ask the county to take another look at our request for more permanent staff on the 101 budget line. Currently Onondaga County staffs its elections board at the worst rate when compared to other county boards across the state. When the election reforms of 2019 were passed, many counties added personnel yearly to accommodate the new requirements. Even in 2019, the Onondaga County Board was one of the worst staffed in the state and we did not add any permanent positions until the legislature added 2 in 2022 and 2 more in 2023.
However, even with those positions added Onondaga County remains, by far, the least staffed in New York State. Onondaga has 1 full time employee for every 15,224.30 voters. New York State averages 1 full time employee for every 7,206.09 voters. Upstate New York averages 1 full time employee for every 7,512.49 voters. Large counties over 100k average 1 full time employee for every 8,257.72 voters. Other counties are continuing to add to their roster as 2024 approaches. Even if we add employees, as asked, it is likely we will remain in the bottom fifth of Election Boards across the state. See the relevant data in this spreadsheet on our website:
http://www.ongov.net/elections/documents/NYSBudgetEmployeeComparisons.xlsx
Adding 2 Voting Machine Custodians to help our warehouse team deal with the influx of technology we have is vital to our operations. We have added 450 Know Ink Poll Pads, 150 Know Ink Poll print on-demand printers, and now 225 Clear Ballot Scanners and 175 Clear Mark Ballot Marking Devices over the last 4 years. This is an investment of nearly $6 million in Federal and State grants as well as County Capital funds. We need the additional 2 Voting Machine Custodians to pair with our 2 existing Voting Machine Custodians to keep this investment up to date and working for the voters.
We are also asking for 4 additional Election Clerk 2 positions. In the 2024 election, we expect the addition of automatic registration, expanded use of online registration, 10-day registration cut off and early voting by mail will create a permanent need for more highly trained staff. These election clerk 2 positions can focus on voter registration and assist the absentee department in processing absentees.
Registration forms processed by our department has grown by over 200% in recent years. As was highlighted by our neighbor the Oneida County Board of Elections in 2020, not processing registration forms that are timely is not only illegal, but it also leads to national news stories of embarrassing nature. We are determined to avoid this mistake. See this spreadsheet on our website:
http://www.ongov.net/elections/documents/AnnualRegistrationFormsProcessedData.xlsx
Even adding the 6 additional employees, Onondaga County’s ratios of full-time employee to voter would be only 1 for every 11,750 voters, well below the state average and likely in the bottom fifth for next year.
Our request for overtime on the 102 line was nearly met. However, that was considering the addition of 6 permanent and 6 temporary personnel. If our department were not to have those personnel, the need for overtime will increase from our submitted request. However, to burden our staff with that type of overtime is not healthy nor sustainable. We have already had a half dozen employees leave our Board to retire early or seek other employment since 2020. The number one reason they cite for leaving is the mandatory overtime around election time to catch up on the registration burden.
Using 2022 Actual Spending as a template is more accurate but does not go far enough.
Using 2022 actual spending as a barometer to base the Board of Elections 2024 budget may be more accurate. However, adjustment to those numbers need to be made in order to properly fund election operations. In, 2022 we had three elections; two primaries and a general election. The Board of Elections has already applied the actual spending in 2022 as a guide to come up with much of the 2024 budget submission. It is important to remember that what drives cost upward from the actual spending in 2022 to 2024, is the sheer volume of participation that a Presidential election creates. The voter turnout in the 2022 primaries was 14.60% (June) & 16.93% (August). The 2020 Democratic primaries was doubled in comparison at 32.80%. The nature of this primary was uncontentious yet still turning out a significant voter participation. The 2016 Presidential turnout was 41.56% and the 2018 midterm primary turnout was 18.33%.
The general election for 2022 had a 56.23% turnout and the 2020 election had a 77.02% turnout. We anticipate a significant increase in voter participation in 2024 than 2022. This means more registration forms and more absentee applications to process throughout the year. In 2020, we processed 107,289 registration forms. In 2022, we processed 66,308 forms. In 2020, we processed 101,259 absentee forms in 2 elections but that was certainly increased because of COVID. In 2022, we processed 25,355 absentee application over 3 elections. As turnout rises, participation of each form of voting rises as well. Increased participation requires more staff needed to process registration and absentee applications and ballots, as well as more inspectors at the polls to process the voters heading to their poll sites. Historically, the Board of Elections has hired a minimum of six temporary staff members in Presidential election years. The necessity of temporary staff members is greater now more than ever to meet the recent changes in election law.
Election law changes will also drive costs upward from 2022. In 2023, online voter registration through NYSBOE was launched. In 2024, early voting by mail as well as automatic voter registration will launch. All these bills together should generate even more registration and absentee work for our permanent and temporary staff in 2024. Best estimates by advocates and state board personnel indicate we could see an immediate jump of 25-30% registration in 2024.
We are requesting a hearing the week of September 25th or later so we can take questions and present our testimony to the Onondaga County Legislature. These significant reductions in our bi-partisan request not only will impair our ability to serve the voters of Onondaga County, but it will also harm the health of our existing staff. The funding levels also reflect several seeming violations of election law. We will be facing a choice to spending significantly more than is allocated or violating our oath to serve the voters of Onondaga County.
We hope you will see the need to invest in our democracy by properly funding and staffing our Board of Elections as we head into one of the most pivotal and highly contested elections in our generation.
Commissioner in a Car: Onondaga Budget for 2024
This week I talk about the budget process for the Onondaga County Board of Elections and how we are facing a $1 million hole for 2024. I also give a brief reaction to Kevin McCarthy’s ouster as Speaker of the House. Enjoy.
Subscribe to dustinczarny.com for all content and election news updates
The Weekly Wonk: Onondaga County Legislative District 7
Welcome back to #WeeklyWonk. Each weekend I publish an article on a subject relating to elections in Onondaga County and New York State. Often these articles will have detailed stats to consume but sometimes they will be a recap of a prominent issue or on relevant election law. I am turning my eye to the 2023 elections. Today this series turns away from the towns of Onondaga County and to the Onondaga County Legislative districts that have competitive races. This week I investigate Onondaga County Legislative district 7.

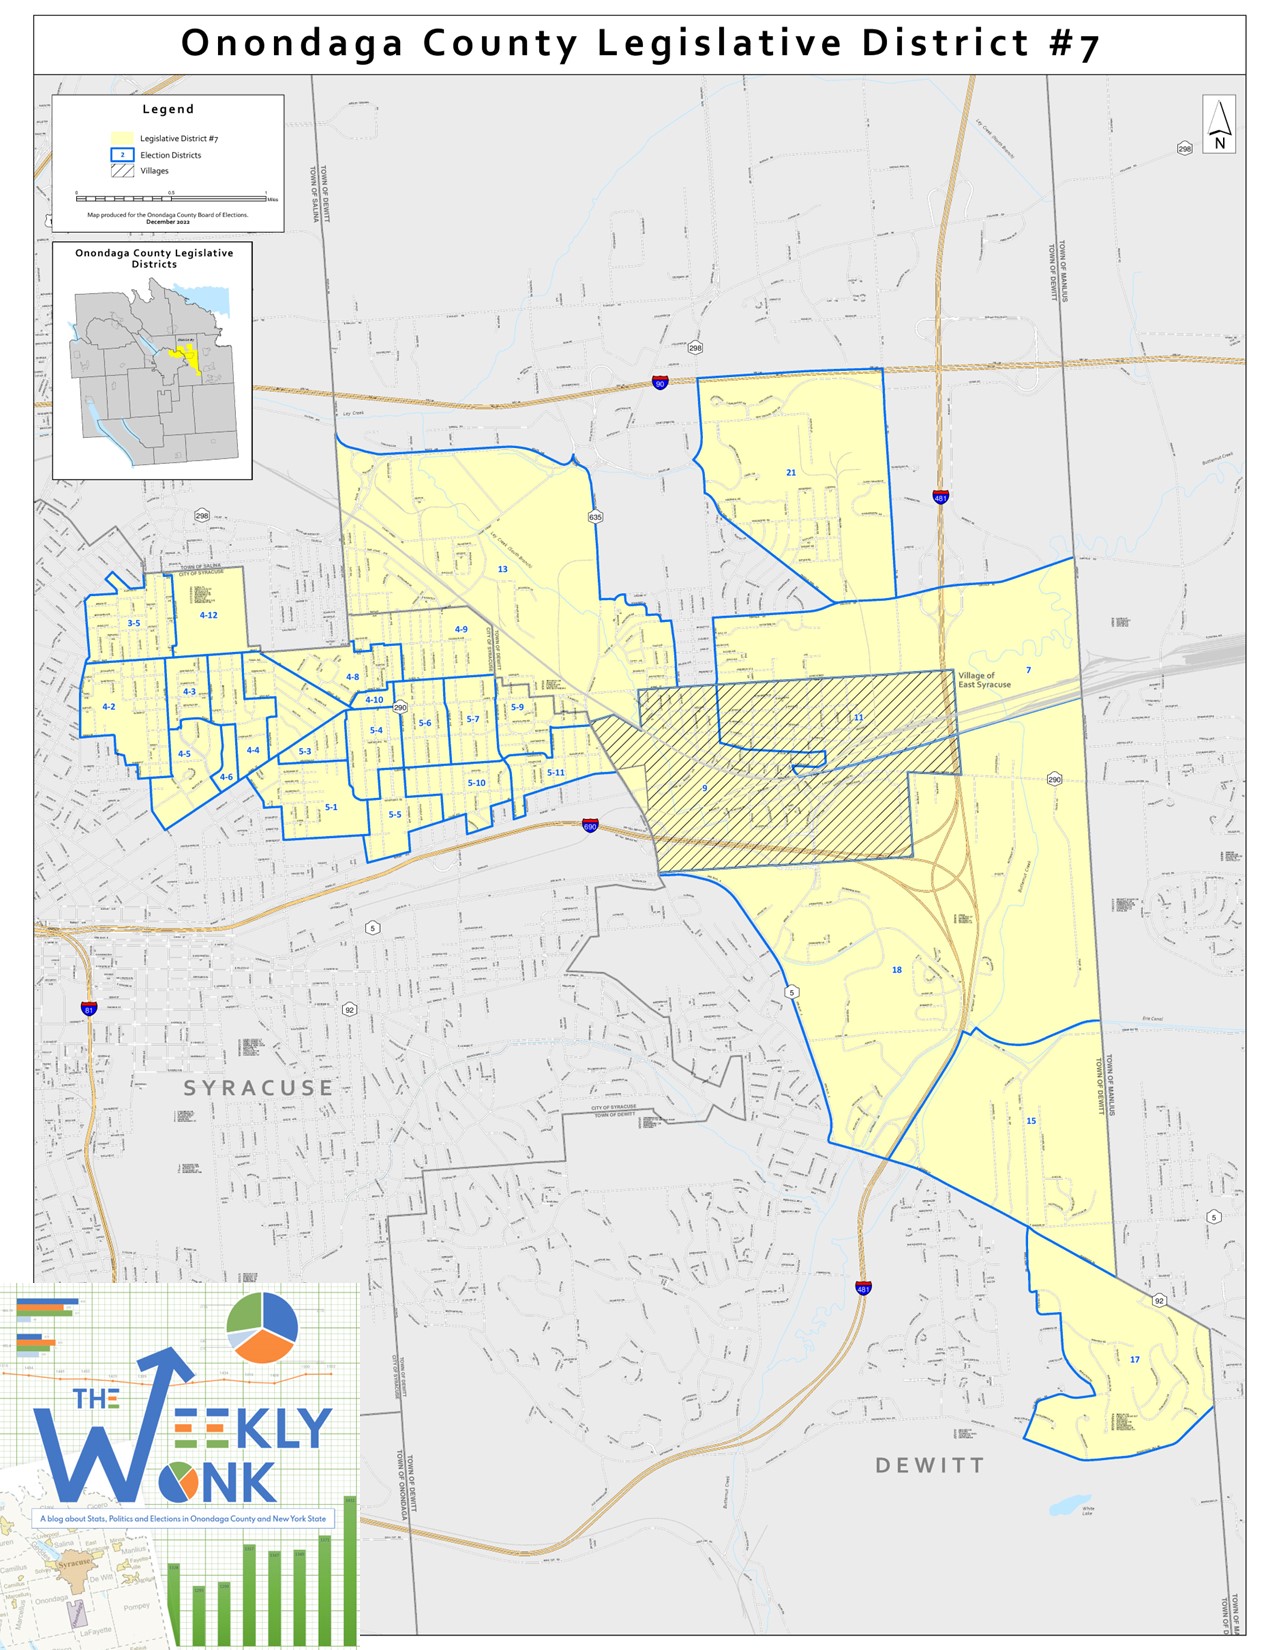
OCL 7 sits in the northeastern part of the City of Syracuse and middle portion of the Town of Dewitt including east Syracuse. Before redistricting it had more of the town of Dewitt and wrapped around the City of Syracuse including some of the 17th Ward. The southern part of Dewitt and 17th ward portions were drawn out and more of the city was added. This made the current makeup of OCL 7 slightly larger and slightly more Democratic than before with 17,723 active voters. The partisan breakdown is 44% Democrat (7,751 Voters), 20% GOP (3,623 Voters), and 32% non-enrolled (5,682 voters). OCL 7 is made up of three distinct regions, parts of the 4th Ward of Syracuse (with one ed from the 3rd ward), parts of the 5th ward of Syracuse, and parts of the Town of Dewitt. The part of 3&4th ward of Syracuse is the largest portion of the district with 6,328 voters (36%), followed by the center portion of Dewitt with 5,713 voters (32%), and the parts of the 5th ward with 5,682 voters (32%).

In a new feature I am bringing to the #weeklywonk this year I am doing a heat map for each political subdivision. I will be looking at the current partisan makeup of each individual ED and heat mapping its partisan lean based on the advantage for the Democrats and GOP. Looking at the heat map we really see that OCL 7 has some of the most Democratic leaning election districts in the county. 19 of the 28 election districts (Ward 3 ED 5, Ward 4 eds 2, 5, 6, 8, 9, 10 & 12, Ward 5 Eds 1, 3, 4, 5, 6, 7, 9, 10, & 11, & Dewitt 18) rate in the highest category with over an overwhelming +20% Democratic lean. 2 eds (Dewitt 11 & 21) has a strong Democratic lean with (+15-20%). 4 eds (Dewitt 7 & 9, Syracuse Ward 4 eds 3 & 4) have a moderate Democratic lean (+10-14%). 2 eds (Dewitt 13 & 15) have a slight Democratic lean (+5-9%). And one ed, Dewitt 17) has a borderline Democratic lean (+0-4%).

OCL 7 is a mostly City district and has followed the same pattern that the City of Syracuse has since 2011. A growing Democratic enrollment, a rapidly growing non-enrolled population, and a rapidly decreasing GOP enrollment. Republicans lost 884voters, Democrats gained 1,332 voters, and the non-enrolled gained 1,644 voters from 2011-2022. Though the redistricting plan was passed by the legislature and county executive in 2021, the lines did not go into effect until the 2023 elections. With the new lines in place, we see an even more Democratic and non-enrolled population. The GOP lost 135 voters, the Democrats gained 377 voters, and the n/e gained 600 voters. The GOP redistricting plan used OCL 7 to stack more Democrats into to protect some of the GOP held seats that touch on northern and southern Dewitt.

All three regions of OCL 7 have a Democratic lean, with the city portion leading the way. All three regions the non-enrolled outnumber the GOP indicating massive Democratic tendencies. The Ward 3 & 4 part region has the most Democrats but the 2nd biggest Democratic lean with +23.29% enrollment edge. Ward 5 part is the most Democratic with +28.65. The town of Dewitt portion is still a solid Democratic lean with +12.38%.

Looking at the growth of voters since the last redistricting cycle we compare it with the data from right before redistricting of 2011. The area of the new OCL (post 2022) itself grew by 1,660 voters, The largest growth occurred in the Ward 3 & 4 region (662). This is followed by the Town of Dewitt (552). Finally, Ward 5 part grew by 446 voters. Redistricting makes this comparison tricky, however if we look at the effect of the redistricting lines had on the old district, it gained 385 voters.

Redistricting really makes looking at the long-term Democratic trend of a district troublesome. If we just look at the eds that are in the new district the current version of OCL 7 grew 9.53% more Democratic since 2011. The city portion grew the most with Ward 3 & 4 growing by 10.26% & Ward 5 grew by 10.31%. The Dewitt portion grew substantially more Democratic with as well, by 7.96%. However, if we want to look at the effect redistricting had on the old vs. new district, we see it grew more Democratic by 2.51% just by changing the lines.
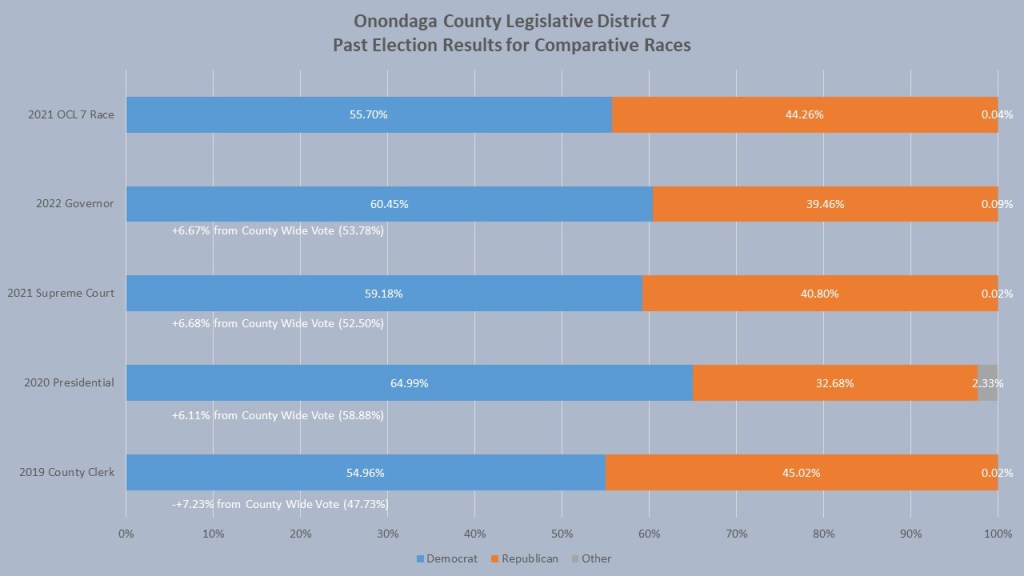
Unfortunately, when we look at the comparative races, we can only run numbers at the OCBOE for the old district when the races all happened. With the Democrats gaining 2.51% in redistricting, we could see an even larger leads for Democratic candidates in this district. The old OCL 7 district performed consistently 6-7% better than Onondaga County as a whole. In 2022 Governor Hochul won this district with 60.45% of the vote, 6.67% more than her totals in Onondaga County. In 2021 Anthony Brindisi won this district with 59.18% of the vote in his race for Supreme Court, 6.68% ahead of his totals in Onondaga County. In 2020 President Biden won this district with 64.99% of the vote, 6.11% ahead of his win total in Onondaga County. In 2019 Mark Kolinski won this district with 54.96% of the vote, 7.23% ahead of his total in Onondaga County. In 2021 Mary Kuhn was re-elected with 55.70% of the vote despite running against Ed Carni, a well-financed GOP politician with a history of winning inside the city.

Mary Kuhn, however, is not running for re-election in 2023. Part of the GOP redistricting was to draw her and Linda Ervin into the same district, and out of district 7 creating an open seat. Dan Romeo is the Democratic candidate for this seat, an E. Syracuse fireman and City of Syracuse school board member. You can learn more about his campaign here: https://www.facebook.com/RomeoForLegislature.
That is, it for this week’s edition of the #WeeklyWonk. I have finished my investigations into the Towns of Onondaga County. I have now turned my attention to the competitive seats for the Onondaga County legislature. With only 5 seats in contention this will take me close to Election Day when I will take another look at Onondaga County and the City of Syracuse. Next week I will investigate Onondaga County Legislative District 10, which historically has had the closest results the last 3 cycles and potentially the most likely Democratic flip. Subscribe to dustinczarny.com for all content and election news updates.
Bill would make impersonating an elections official in N.Y. a felony – Spectrum News
“Voters should not be harassed at their homes for just simply registering to vote and they should definitely not be told that election personnel are doing that. We just don’t have the resources to do that even if we wanted to and we would never go door-to-door,” Onondaga County Democratic Elections Commissioner Dustin Czarny said.

