The Weekly Wonk: How Voters Participated in the 2025 General Election

The #weeklywonk is back. My weekly column on election and registration data in Onondaga County and throughout New York State has been running since the middle of 2020. I took a hiatus for this column for the last part of 2024 and 2025 while I reevaluated what content I wanted to bring to dustinczarny.com. There were occasional columns around elections, but I am happy to say I Am back and doing this weekly for the rest of 2025 and 2026. I have found new ways to present data effectively. This week we continue my three parts look back at the 2025 General Election. Today I bring to you Part 2: How Voters Participated in the 2025 General Election.

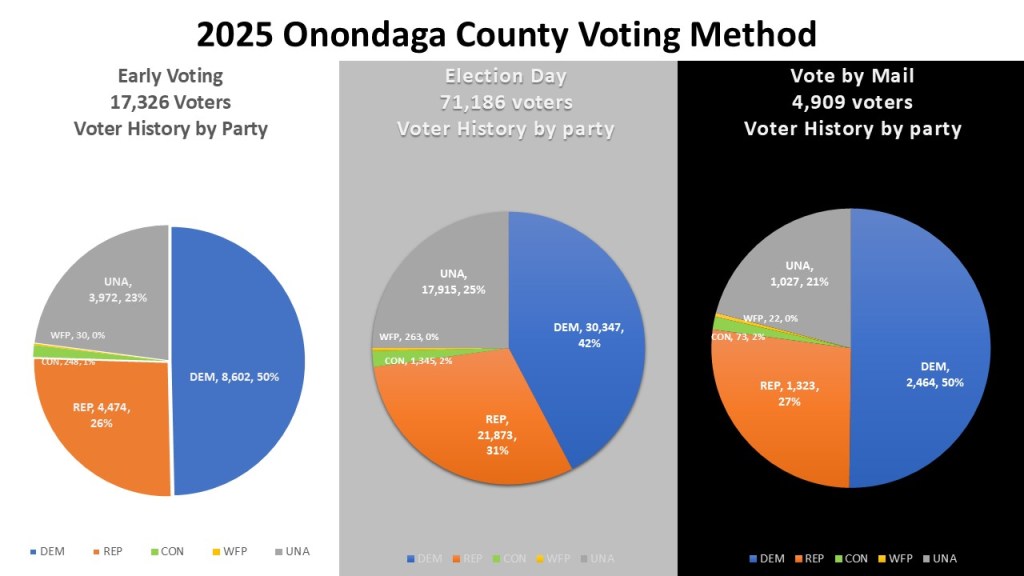
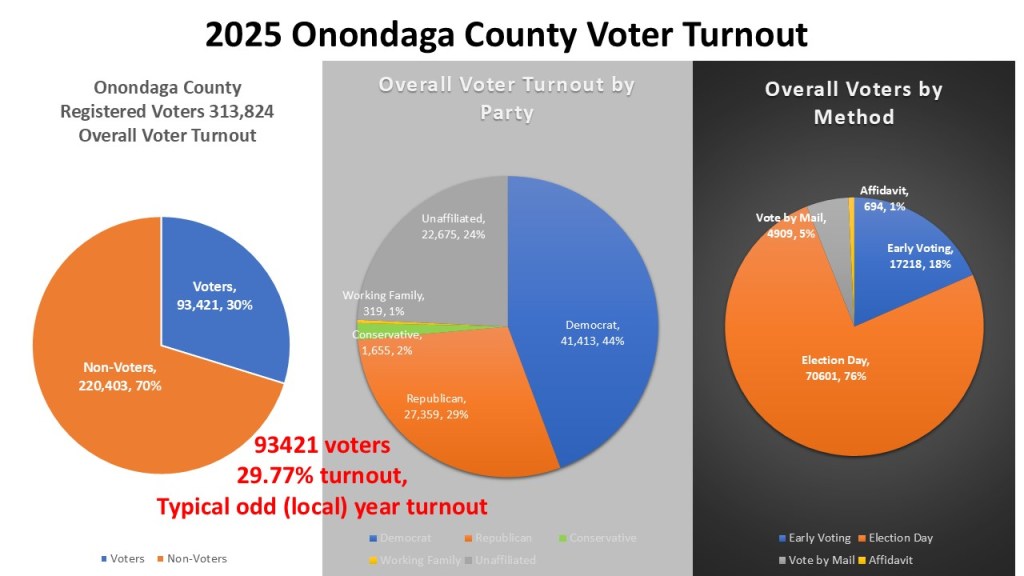
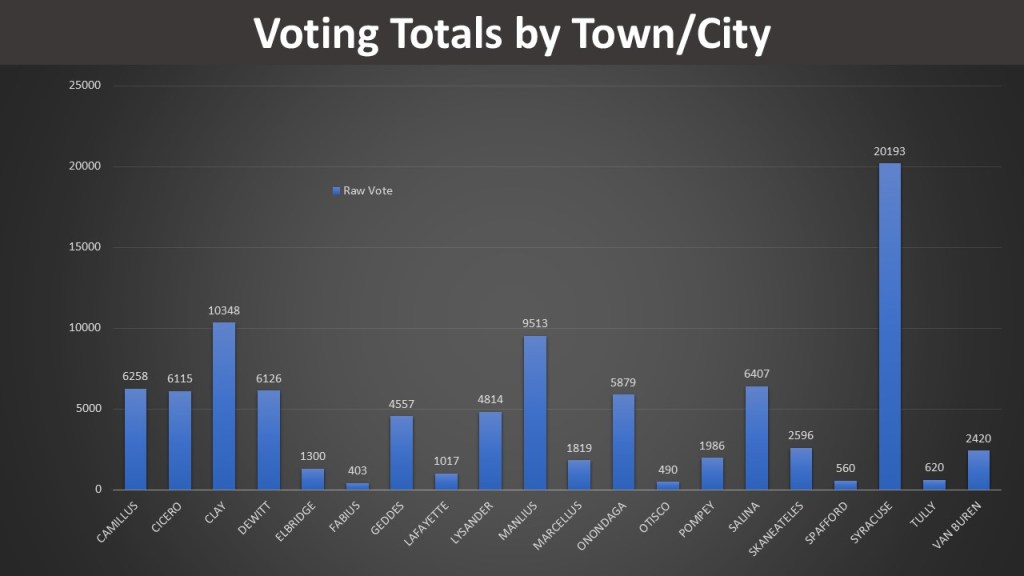
For this column I will focus on three main ways voters participated, Early in Person voting, Vote by Mail, and Voting on Election Day. This data brought to you by the official voter turnout starts at the Onondaga County board of Elections which lumps all voters outside of the four major parties with the unenrolled into the Unaffiliated category. Early In Person Voting includes voters who voted at our 10 Early Voting stations during the EV period including regular voters, court orders, and affidavits. 17,326 voters participated with 50% (8,602) who were Democrats, 26% (4,474) who were Republican, 23% (3,972) who were Unaffiliated, 1% (248) Conservative, and >1% (30) Working Families parties. Election Day also has regular voters, affidavit voters, and court orders and totals 71,186 voters. Forty-two percent (30,347) were Democrat, 31% (21,873) were Republican, 25% (17,915) were Unaffiliated. Two percent (1,345) were Conservative, and >1% (263) were Working Families. Vote by Mail voters include Absentee, Early Vote by Mail and UOCAVA/military voters. 4,909 voters participated by mail with 50% (2,464) Democrat. Twenty-seven percent (1,323) Republican, 21% (1,027) Unaffiliated, 2% (73) Conservative, and >1% (22) Working Families Party. Democrats were the plurality of every vote method but were more represented in Early and Vote by Mail voters.

Looking at Early Voting in 2025 we see that it is another example of #earlyvotingisgrowing. As I did last week, I am going to focus on just the local years: 2018, 2021, 2023, & 2025. With four years of Early Voting during off-year elections we really see significant progression. Furthermore, to compare apples to apples I am looking at check-in data here and excluding court orders and affidavits. The Early Voting totals in 2025 of 17,218 which is 18.43% of the overall vote in 2025. Both the raw number and percentage of vote is double what we saw in  in the first local year (8,462 7.87%),  Significant progress has been made each local year with 2021 (9,727 10.31%) and 2023 (12.680 13.96%) showing growth culminating in the record year we saw in 2025,  Early Voting continues to grow in its popularity in local years even if it trails the percentages and numbers in even years.

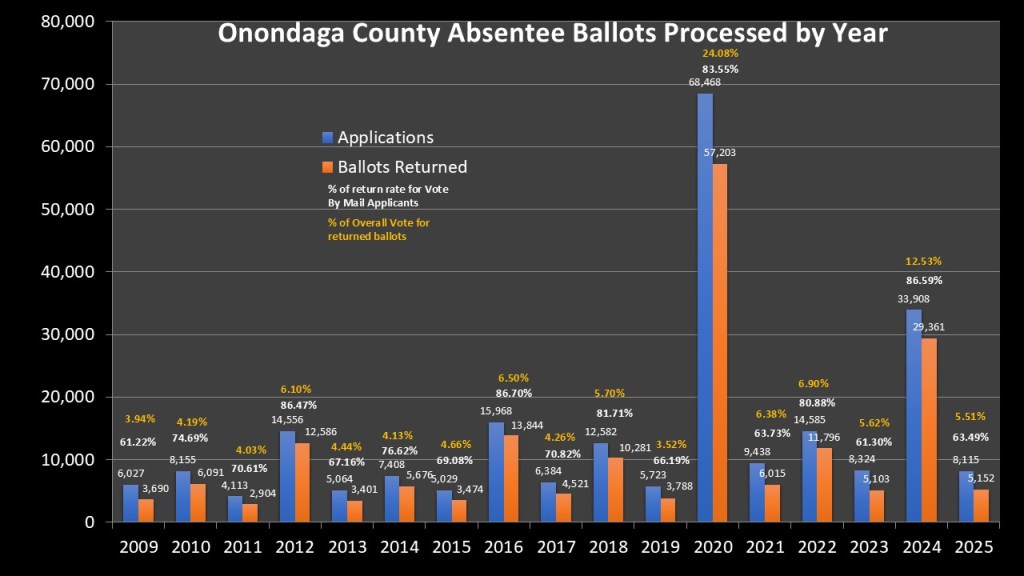
On the other side of the discussion is Vote by Mail. Unlike Early Voting, the vote by mail has not grown significantly during local years. This dataset analyzes returned ballots, including those rendered invalid because of unresolved technical problems. There were 5,152 ballots returned out of 8,115 ballot requests made in 2025. This resulted in a return rate of 63.49%. These ballots accounted for only 5.51% of the total votes cast. This is like 2023 (5103 out of 8324 61.30% return rate 5.62% of the vote) and significantly less than 2021 (6015 out of 9,438 63.73% return rate and 6.38% of overall vote). The 2021 data seem higher than usual because of the pandemic’s effects that year. In contrast, when EV debuted in 2019, its return rate stood at 66.19% (3,788 returned out of 5,723), and it made up just 3.52% of the total vote—both numbers falling below the projections for 2025.  Voting by mail is more popular than when New York changed our Democracy to add more options, but it is not growing at the rate that EV is.

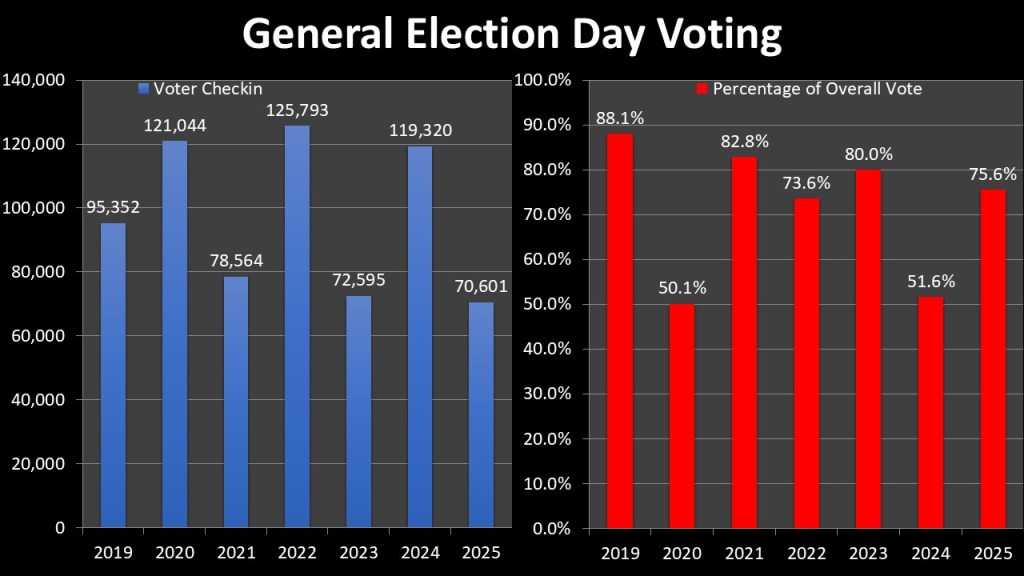
Election Day voters continue to be the most popular form of voting, but it is falling in both numbers and percentage of the vote for local years. Once again, we are looking at voter check-ins and not affidavit or court orders. On Election Day 2025 we had 70,601 voters and it represented 75.6% of the votes. This is the lowest of all four Election Day local years in the modern era. We see a downturn each year with 2023 (72,59*5 80.0%), 2021 (78,564 82.8%) and 2019 (95,352 88.1%) all lining up with a steady and downward progression. More Onondaga County voters are choosing alternative voting choices, specifically Early Voting, during local year elections.

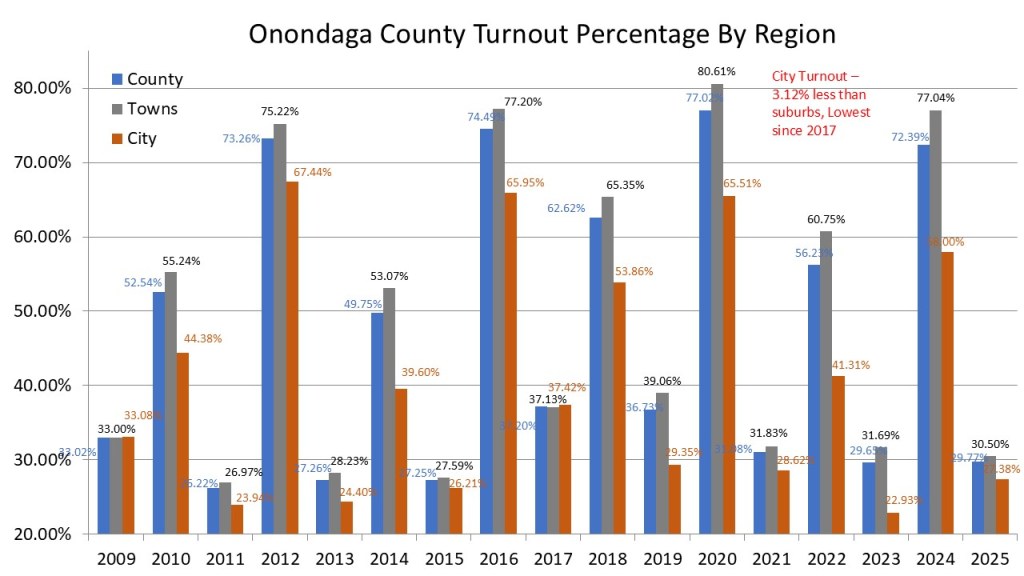
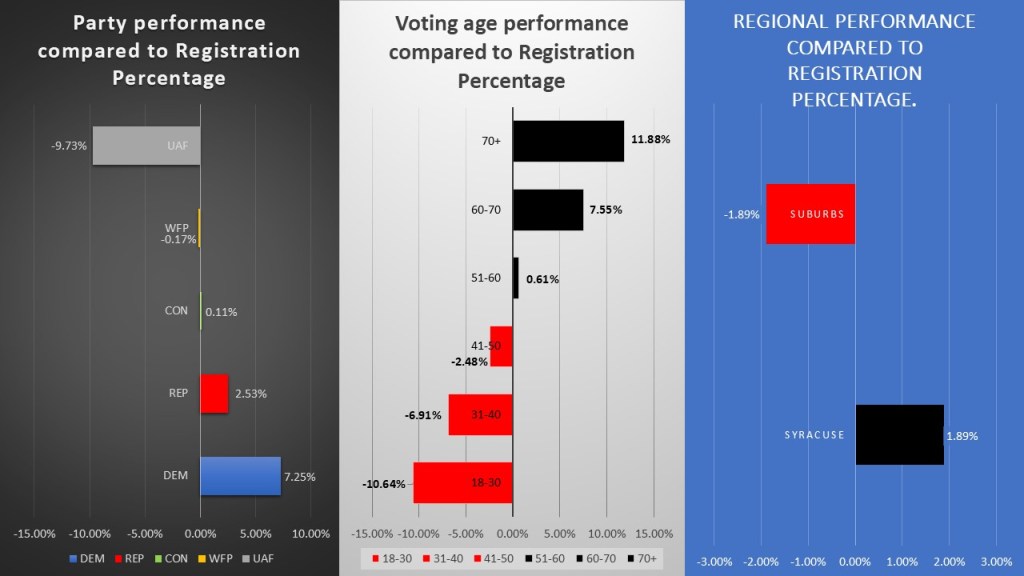
When it comes to partisan choices, we can see that in 2025 how and why Democrats had such a good night last month. When comparing the methods of voting to overall voter registration, Democrats outkicked their coverage. Democrats represent 37.08% of the overall registration in Onondaga County and overshot that registration as they were 12.57% higher for Early Voting, 5.55% for Election Day, and 13.12% for Vote by Mail. The republicans have 26.76% of the registration and did overshoot their representation for Election day by 3.97% but Early voting (-0.93%) and Vote by Mail (+0.19%) were statistically the same as the voter registration rate.,  Unaffiliated represents 34.00% of the electorate but underperformed in all three voter methods (-11.07% Early Voting, -8.83% Election Day, -13.08% Vote by Mail).  Looking at the partisan trends since 2019 we can see 2025 was a reversion back to the norm after a successful Early vote participation by the GOP in 2024. More of the Democratic vote (28.35%) chose Early Voting than the GOP (20.45%)/ With Vote by Mail Democrats (8.12%) were a larger share of their vote than the GOP (6.05%) but even for Democrats this was a bus drop from last year.

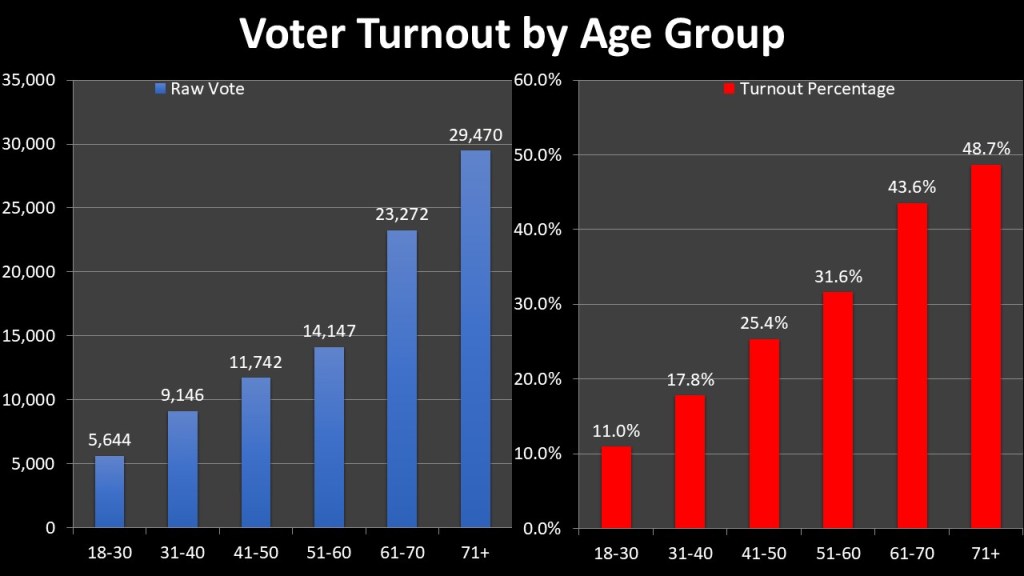
This year I am doing a bigger focus on age groups in the Weekly Wonks. As we saw last week the electorate was significantly older than the overall registration of Onondaga County. So, it is no surprise that the older the electorate gets, the more voters use each of the voting methods. However when we look at the percentage of the age groups vote and the method they choose there is one surprising detail  The two oldest groups 71+ (87.16%),  61-70 (73.87%), 51-60 (81.06%) had the least percentage of their vote choosing Election Day. However, the youth vote 18-30 (82.67%) is lower than 41-50 (86.30%) and 31-40 (86.76%). This could prove a useful tool when trying to address the youth voter turnout issue, trying to steer to alternative forms of voting like Early or Vote by Mail. In fact, with vote by mail the youth vote is the second highest rate of participation only reaching 71+.

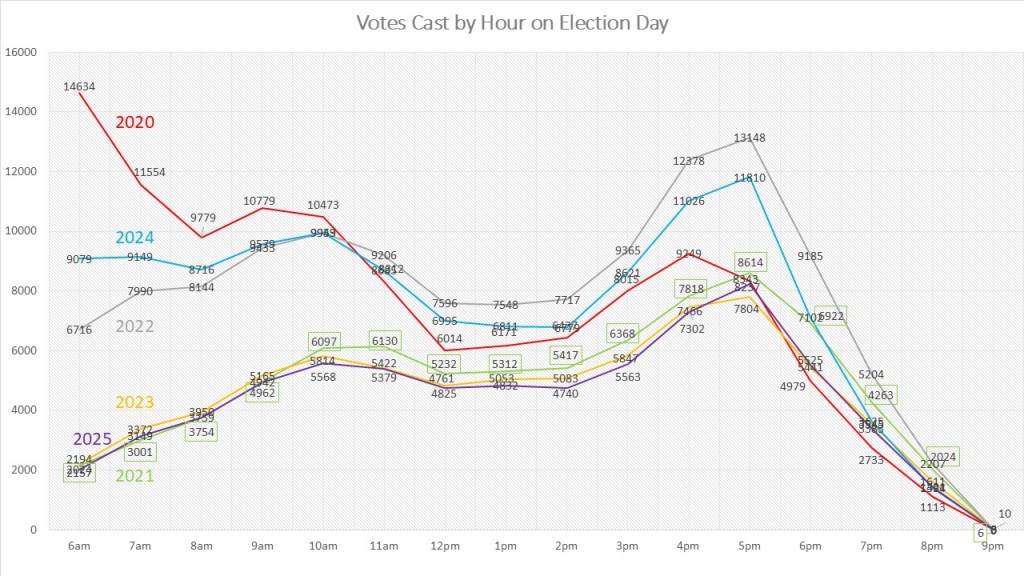
Finally, I like to look at the hourly data on Election Day. There is no statistical value to this other than to manage expectations for future years. Regrettably, access to the 2019 data is unavailable because it was not archived. However, 2025 mimics other local years on record, 2021 & 2023. The day starts of low and builds till about 11 am. There is a slight lull between noon and 3pm. Then there is a dramatic upturn with 4-6pm being the busiest times of the day. We then see a dramatic decrease in the evening hours. This is the same in the one midterm election of 2022 we have data for. The two Presidential elections of 2024 and 2020 acted so dramatically differently we need more data to determine how Presidential and midterm electorates act.

That is, it for this week’s edition of the #WeeklyWonk. Next week I conclude my look back at the 2025 election to look at how Democrats did when it came to elective office. We will analyze districts that have undergone changes in seat allocation, those with consistent seat distribution, as well as regions where both parties contested only a limited number of offices. As always you can subscribe to dustinczarny.com for all content and election news updates. Enjoy.

US Elections Assistance Commission PSA

I serve on the US Elections Assistance Commission Local Leadership council. I was included with some amazing election officials about the dedicated professionals running elections in America. Stay tuned till the end and I close this out, but tune in for the heroes around the nation who run elections

Subscribe to dustinczarny.com for all content and election related news

Commissioner in a Car: How we report write-ins and why it takes so long.

In this week’s episode I talk about how we record write-ins at the Onondaga County Board of Elections. I talk about why some write ins are invalid and some of the limitations of NY Election Law. I recap a bit about my travel to the Cybersecurity summit as well as my last #weeklywonk and activity at the BOE. Enjoy.

https://creators.spotify.com/pod/profile/zoomwithczarny

Subscribe to dustinczarny.com for all content and election news updates

Election Cybersecurity Summit Panel

I was a panelist at the Cyber Security Summit hosted by the Brennan Center and Common Cause NY and the Center for Long term Cybersecurity at the NYC Bar Association on December 11, 2025. My panel focused on specific ways County Board of Elections are looking to protect our elections as well as the challenges we face. Enjoy. See the whole summit here:

https://www.youtube.com/live/CUKfxKxCuGs

You can also listen to this in podcast form here:

Subscribe to dustinczarny.com for all content and election news updates

The Weekly Wonk: 2025 General Election Turnout

Welcome back to the #WeeklyWonk. This is my weekly look at election related stats and demographic information that is important to Syracuse, Onondaga County, and New York State. I took a brief hiatus from this blog in 2025 but now that 2025 election is officially certified, along with manual recounts and write-ins, we can now take an official look back at the stats that made up the 2025 election. As we close out December, I will do this in three parts: Election Turnout, Election Methods, & The New Blue Onondaga. This week we dive into part 1: 2025 General Election turnout.

For the 2025 General Election Onondaga County had 313,824 registered voters. Of them 93,421 (30%) turnouts while 220,403 (70%) stayed home. Of those that turned out 41,413 (44%) were Democrat, 27,359 (29%) were Republican, 1,655 (2%) were Conservative, 319 (1%) were working families. Another 22,675 (24%) were Unaffiliated. Meaning either non-enrolled or enrolled in an unrecognized party. Also, of those who turned out 70,601 (76%) voted on Election Day, 17,218 (18%) voted Early In-Person, 499 Voted by Mail, and 694 voted by Affidavit (either on Election Day or during Early Voting). We will go more into voting next week. The official voter turnout percentage was 29.77%. On its surface this was a typical local (odd) year turnout like 2023 (29.64%) and 2021 (31.08%).

To get a true sense of what happened in 2025, we must look at party turnout. There are always way more Democrats enrolled than republicans in Onondaga County, in fact the GOP are behind the Unaffiliated voters. However, every year the Democrats fail to turnout in as high a percentage of their enrollment as the GOP and thus undercut their strength in numbers. This year though, for the first time since 2009 (where I have data back to) the Democrats turned out in higher number and Higher percentage. Democrats turned out 35.59% of their electorate (41,413/116,353). Republicans turned out at 32.587% (27,359/83.970). The Unaffiliated turnout percentage is always much lower than the two major parties despite their numbers with just 21.25% turnout (22,675/106.687).

New year I wanted to look at voting age groups. To do so I broke Onondaga County into six distinct age ranges. As we can see this year, as every year, the age of the electorate is distinctively older. The older an age group, the higher in both raw numbers as well as the percentage of their registered numbers. 18-30 had 5,644 voters (11.0%), 31-40 9146 voters (17.8%), 41-50 11,742 (25.4%), 51-60 14,147 (31.6%), 61-70 23,272 (43.6%), 71+ 29,470 (48.7%). This means that 52,742 voters or 56.46% of the electorate that showed up was age 61+.

The next demographic to look at is regional turnout.  Traditionally Onondaga County turnout into two distinct regions, The City of Syracuse and the Suburbs.  The City of Syracuse, like with most urban centers, is usually a drag on voter turnout.  The only year since 2009 that City of Syracuse turned out at a higher rate than the suburbs was in 2017, the last open mayoral contest. That is true this year as well but bnot be ,uch.  Suburban turnout did outpace overall turnout at 30.50%, however the City turnout of 27.38% was only 3.12% behind the suburbs.  This is the best City performance since 2017 and is due to the mayoral election generating turnout.

Even though the City of Syracuse trailed the suburbs in percentage of turnout, by sheer numbers they dominate raw number turnout.  The 20,193 voters in the City of Syracuse is twice more than the #2 (Clay 10,348) and #3 (Manlius 9,513). We can see that Onondaga County has two class of suburban towns after that. Suburban moderate sized towns like Camillus, Cucero, Dewitt, Geddes, Lysander, Onondaga, & Salina which span from 4557 – 6407 voters.  After that we have the smaller agrarian towns Elbridge, Fabius, Lafayette, Marcellus, Otisco, Pompey, Skaneateles, Spafford, Tully, and Van Buren spanning from 403 – 2,596 voters.

Further looking into the regional differences there is a stark difference to last yea’s performance.  The City of Syracuse was so far behind the suburbs last year that there was not a ward inside the City that eqaled or surpassed any of the towns, not so this year The City of Syracuse (27.38%) had better turnout than 6 of the 17 towns such as Clay (24.16%), Cicero (26.32%), Lafayette (26.58%), Lysander (26.50%), Otisco (26.37%), & Van Buren (24.23%).  In fact the 17th Ward of Syracuse (38.21%) was better than all but two towns.  Other standouts beside are Strathmore (11 31.71%), and Eastwood (5 34.59%) areas.  The king of this year’s turnout was the Town of Skaneateles (43.02%) followed closely by Spafford (41.15%).

Finally, to get a true sense of these numbers we want to look at performance when compared to registration. Here we look at the percentage of turnout in the 2025 General Election when compared to a demographic registration in the overall electorate. This chart gives us a great final look at why this election turned out the way it did. We see that Democrats overperformed their registration by 7.25% which is part of why we saw the results we did last month. Unaffiliated voters severely underperformed their registration by 9.73%. Older voters 61-70 (+7.55%) and 71+ (+11.88%) truly outpaced younger voters 31-40 (-6.91%) and 18-30 (-1064%). The City of Syracuse because of its larger population overcame its turnout deficit and made up a slightly higher proportion of the electorate when compared to its registration. It is important to show these figures when politicians are making tough choices, they will remember who shows up more often than who does not. I hope switching to elections aligned with even years will help balance these numbers.

That is, it for this week’s edition of the Weekly Wonk. Next week I will look at part 2 of my series examining the 2025 General Election. We will look at the methods that voters in Onondaga County choose to vote for this year. As always follow along at dustinczarny.com to get all content and election news information as we get ready for the big midterm 2026 elections.

Commissioner in a Car: Let’s Talk Manual Recounts

In this week’s episode I detail what goes into a manual recount, the results of this week’s close contests, and why I think this law is a good thing, but how we can improve it. As always I detail about what is going on at the Onondaga County Board of elections as well.

https://creators.spotify.com/pod/profile/zoomwithczarny

Subscribe to dustinczarny.com for all content and election news updates

Commissioner in a Car: What method did Onondaga County vote by in 2025?

In this week’s Commissioner in a Car I talk about what method Onondaga County voters chose to cast their vote this last November. I also detail what the Onondaga County Board of Elections did last week to certify the election. i also talk about how we have to break certification for the hand counts and to finish write ins this next week. Enjoy.

https://creators.spotify.com/pod/profile/zoomwithczarny

Subscribe to dustinczarny.com for all content and election news updates

What Voter History tells us about Voting Method in 2025 General Election

One last mini blog on the November election. Today we will look at how people voted in 2025, and by that, I mean which method they chose to vote. This breaks down into three main categories: Early, Mail, Election Day.

Total Voters: 93,421

Early Voters: 17,326 (18.55%)

Mail Voters: 4,909 (5.25%)

Election Day: 71,186 (76.20%)

Election Day is obviously still the most popular option, but the Early Voting portion is growing. Each of these categories has two subcategories in them.

Early Voters: 17,326 (In-Person 17,218, Affidavit 108)

Mail Voters: 4,909 (Absentee 3,322, Early Mail Ballot 1,587)

Election Day: 71,186 (In-Person 70,601, Affidavit 585)

For in person Voting such as Early and Election Day you have in-person voters and declaration of facts voters. In-person voters use the machine, while those with registration issues must complete affidavits and vote using an envelope. Affidavit ballots are examined once Election Day has passed. Mail balloting has two distinct categories: Early Mail Ballot and Absentee. The main difference in these types of mail ballots is Early Mail Ballots are yearly requests that do not need an excuse, and Absentees use excuses to vote, mostly permanently, by mail.

As we have done in other posts, let us look at how the parties chose to vote.

 Early Voters: 17,326 (Dem 8602 49.65%, GOP 4474 25.82%, CON 248 1.43%, WFP 30 .17%, UNA 3927 22.93%)

Mail Voters: 4,909 (Dem 2464 50.19%, GOP 1323 26.95%, CON 73 1.49%, 22 0.45%, UNA 1027 20.92%)

Election Day: 71,186 (Dem 30347 42.63%, GOP 21873 30.73%, CON 1345 1.89%, 263 0.37%, UNA 17915 25.17%)

One of the problems with comparing party performance is the makeup of Onondaga County. Over the last ten years Onondaga County has settled with a solid Democratic plurality. In fact, the GOP has now fallen to third place behind the non-enrolled. In the November Election, out of the 313,824 voters 116,353 were Democrat (37.08%), 83,907 Republican (26.58%), 5,298 Conservative (1.66%), 1606 Working Families 0.51%), and 106,687 (34.00%) in the unaffiliated category.

So, to see how a party performs when it comes to voting method you really need to see how a party performs when compared against the enrollment. We expect Democrats to outnumber the GOP and Unaffiliated because they have the raw numbers. For this post, I am going to subtract the turnout in a voting method by party by that party’s enrollment. This will give us a quick look at how parties performed.

Early Voters: Dem +12.57%, GOP -0.94%, CON -0.23%, WFP -0.34%, UNA -11.07%

Mail Voters: Dem +13.11%, GOP +0.19%, CON -0.17%, WFP -0.06%, UNA -13.08%

Election Day: Dem +5.55%, GOP +3.97%, CON +0.23%, WFP +0.14%, UNA -8.83%

We can see similar patterns for both Early In person voting and Mail voters. Democrats over performed their enrollment stats while the GOP remains remarkably stable. In fact, GOP, CON, and WFP are not that far off their enrollment numbers for both Mail and Early voting. Matching Democrat over performance is Unaffiliated underperformance. Both in Mail voting and Early voting the Unaffiliated tended to participate much less, which is normal as partisan voters, especially in odd years, tend to turn out better than unaffiliated.

Election Day is slightly different. Here we see Democrats also turning out at a higher rate than enrollment though by a lesser amount. The GOP also had a decent higher turnout, but not as much as previous over performances. The Unaffiliated did a little better on Election Day, but still well under enrollment rates.

Thus, one of the stories of the Election is the Democrats used alternative voting such as Early and Mail to over perform their enrollment. By banking votes early, they were able to pivot to non typical odd election year voters and expand their electorate. The GOP did not ignore Early and Mail in voting, but they seemed to have relied on past strategies for Election Day surge. Unfortunately for them the GOP electorate was unenthused, and they decided not to show up. This was the surge seen throughout the country this last election as well as Onondaga County. This is why Democrats were able to take advantage of the wave and flip so many GOP held seats.

In December I will restart my Weekly Wonk series which will go back to Wednesdays. I plan to start this on Wednesday December 10, 2025, with my traditional 2-part series looking back at the 2025 General election with charts and data. I then will resume my weekly look at political subdivisions as we get ready for the huge 2026 election, the first year where the Even Year Election law will start to take effect.

Commissioner in a Car: What does voter history tell us about 2025?

In this week’s episode I talk about how we finished canvassing write ins and affidavits at the Onondaga County Board of Elections. I also talk about what voter history tells us about 2025. Finally I talk about what is to come next week and beyond to finally wrap up the 2025 election.

https://creators.spotify.com/pod/profile/zoomwithczarny

Subscribe to dustinczarny.com for all content and election news updates