Welcome back to the #weeklywonk. This is my weekly column on data and statistics that I publish on dustinczarny.com. Each week I dive in the registration and electoral data around a political subdivision or electoral event affecting Onondaga County. I am currently in the middle of my nine-part series of New York State offices running this year. This week I focused on the Syracuse based NY Senate district. The current names NYS #48 has had a tumultuous past 30 years filled with twists and turns, but the data has been there through it all.
This district has had more heel turns than a Martin Scorsese movie. Onondaga County has always had two Senate districts. Since 2010 there have been two districts, the Syracuse based district, and the suburban based district. The Syracuse based district has changed parties, but not by traditional means. Longtime Democratic Senator Nancy Lorraine Hoffman shortly after the 1998 election stunned Democrats by defecting to the Republican party. The district stayed in Republican hands until Dave Valesky’s beat Nancy Lorraine in 2004. The district stayed in Democratic hands until 2011 when Senator Valesky left the Democratic caucus, but not the party, to join the NY IDC which gave effective control of the Senate to the Republicans. Then in 2018 current Senator Rachel May primaried Dave Velesky and won ushering in the death of the DC and giving Democrats full control of the legislature and New York government for the first time since 2006.
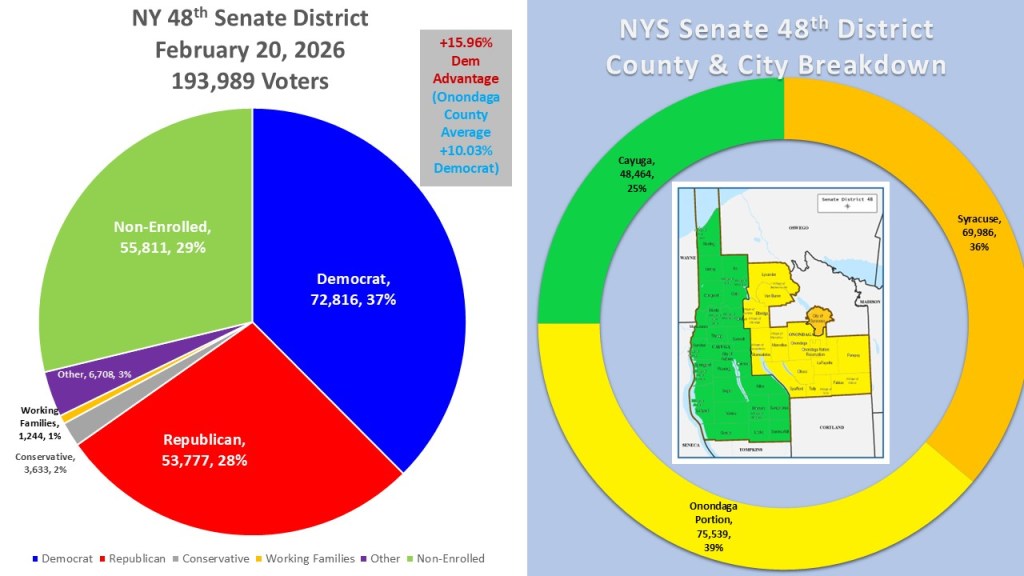
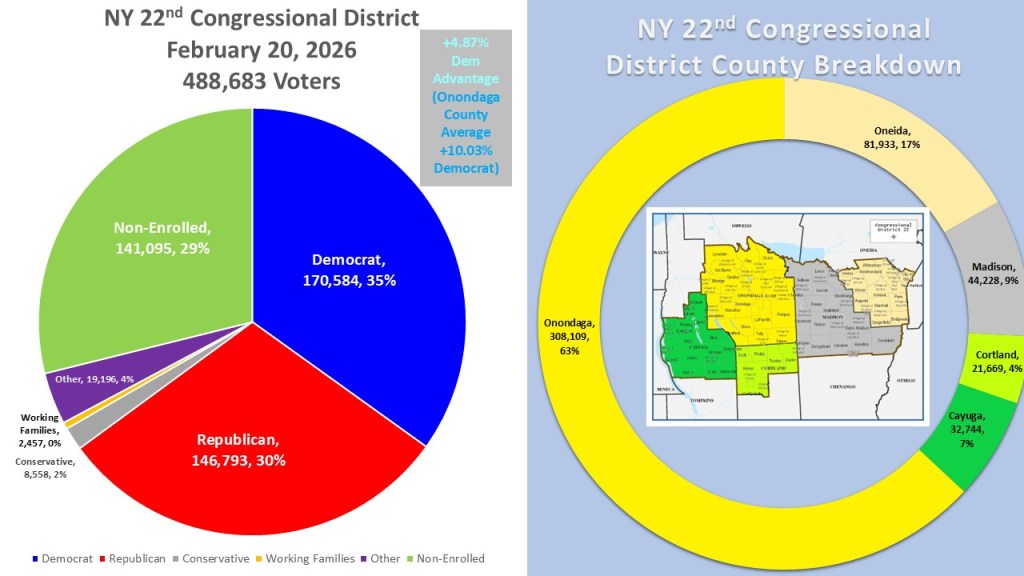
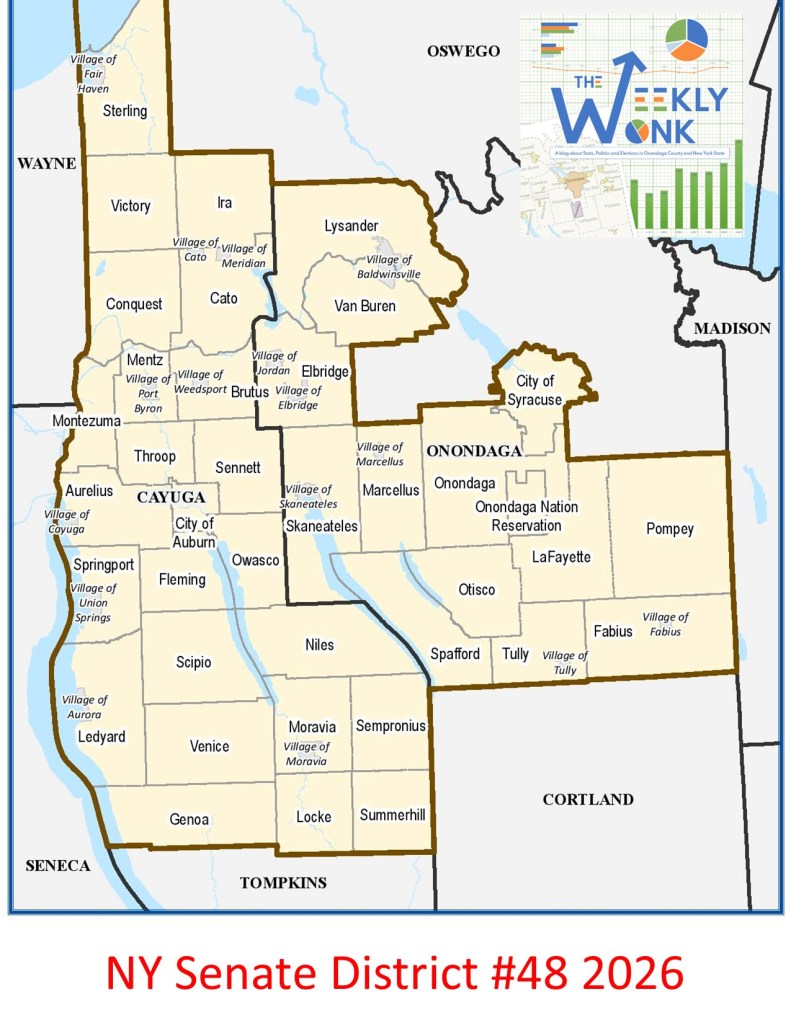
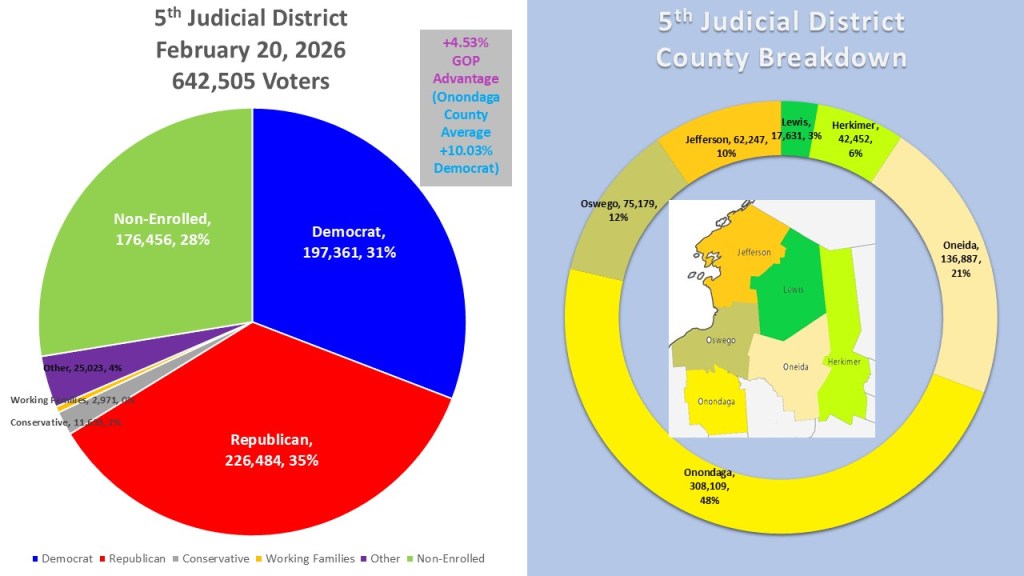
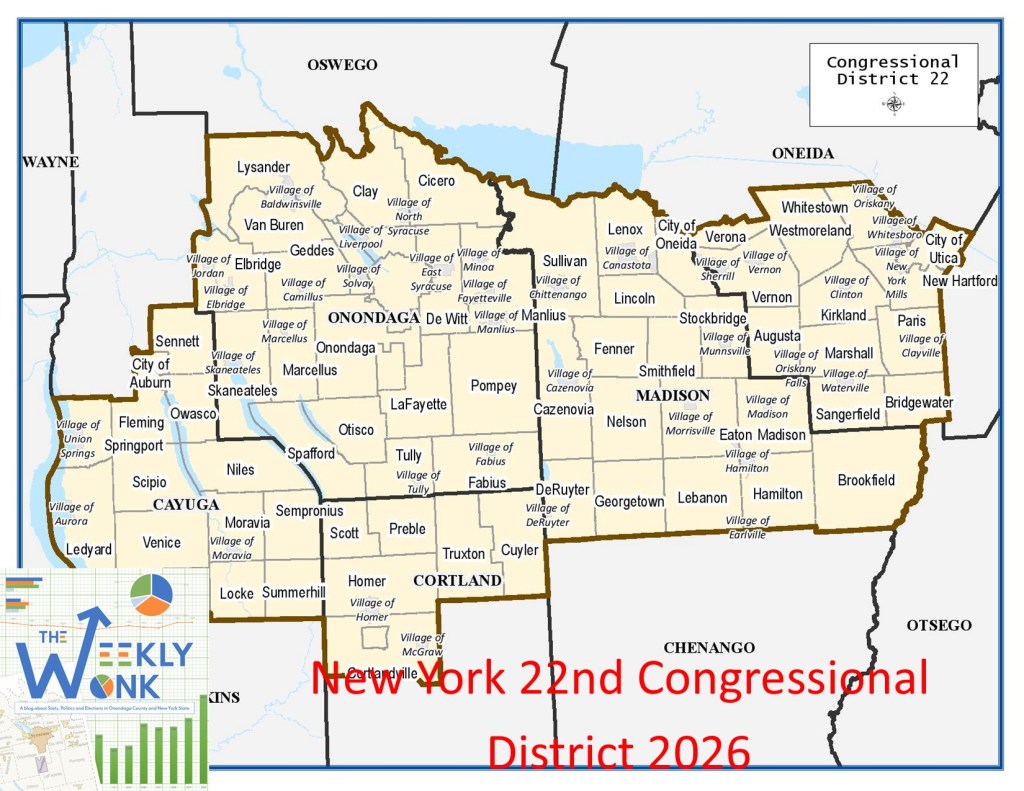
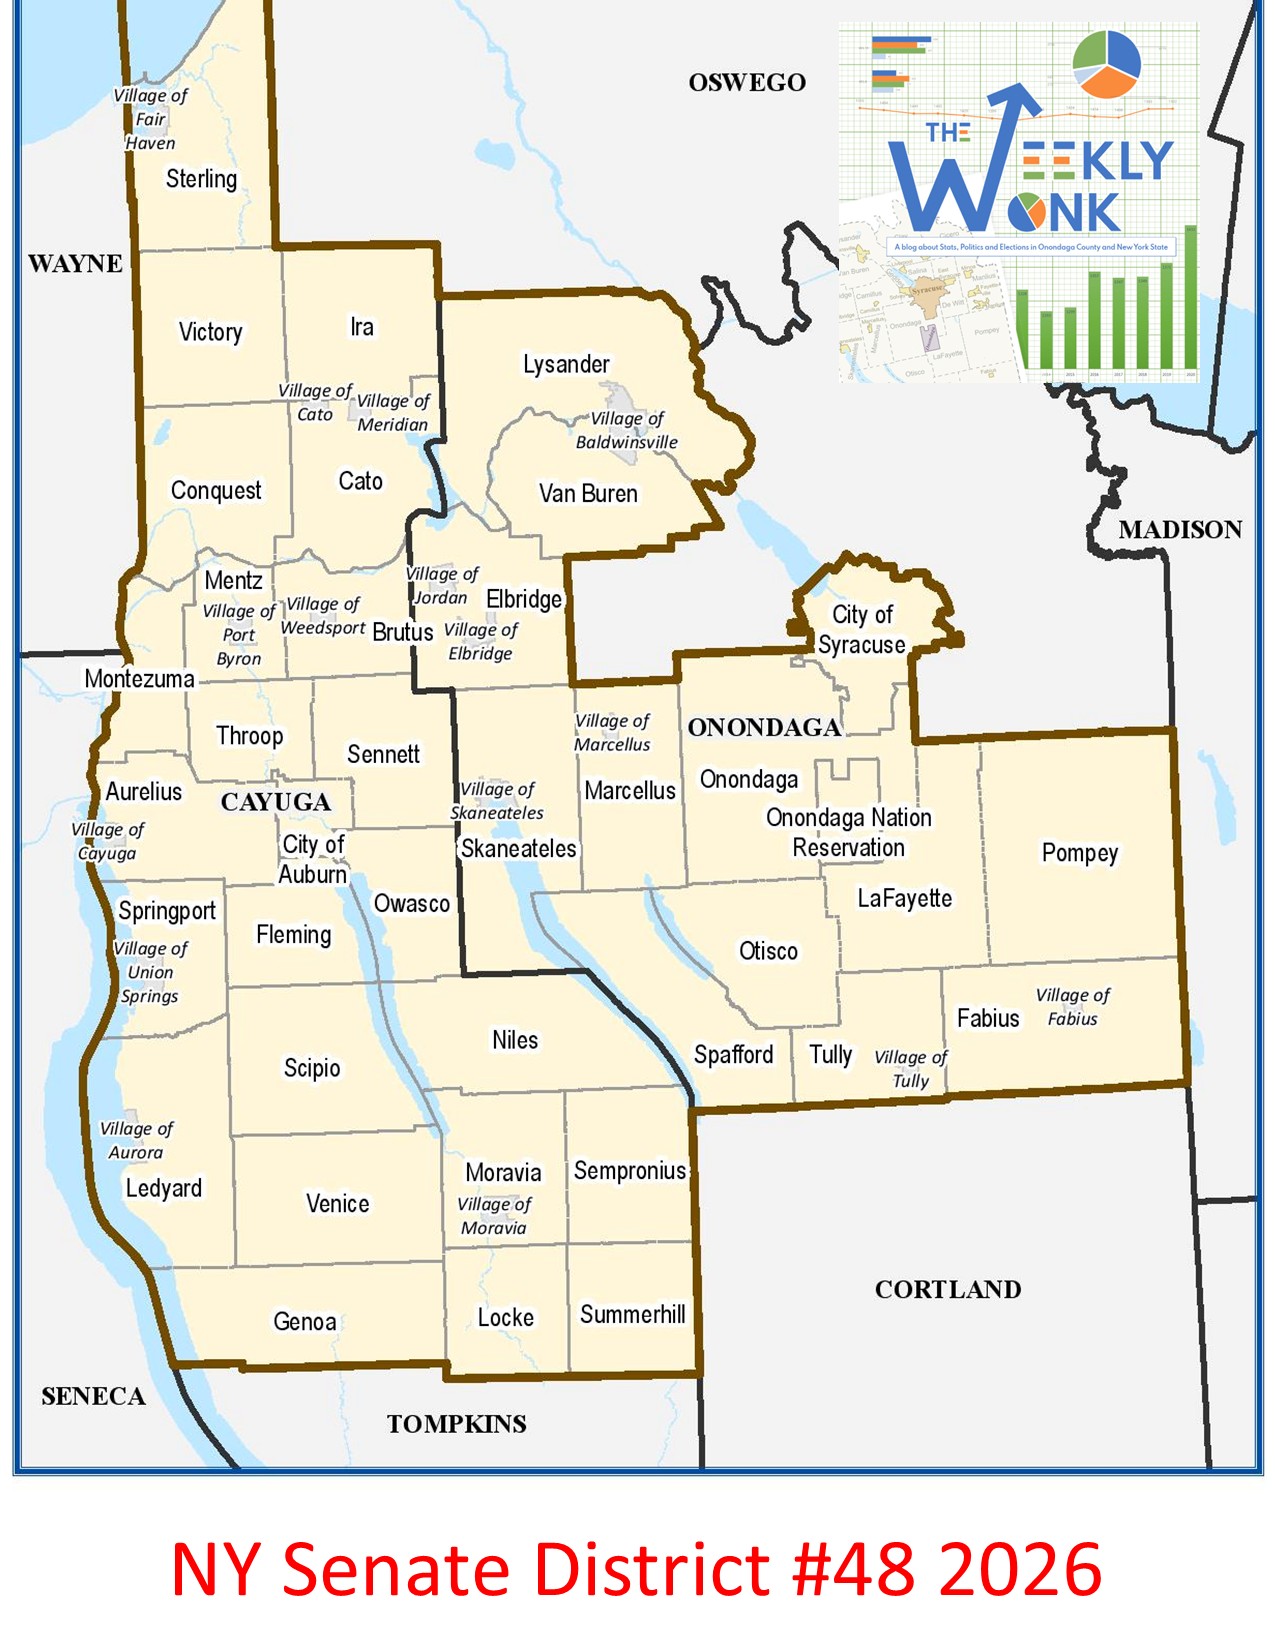
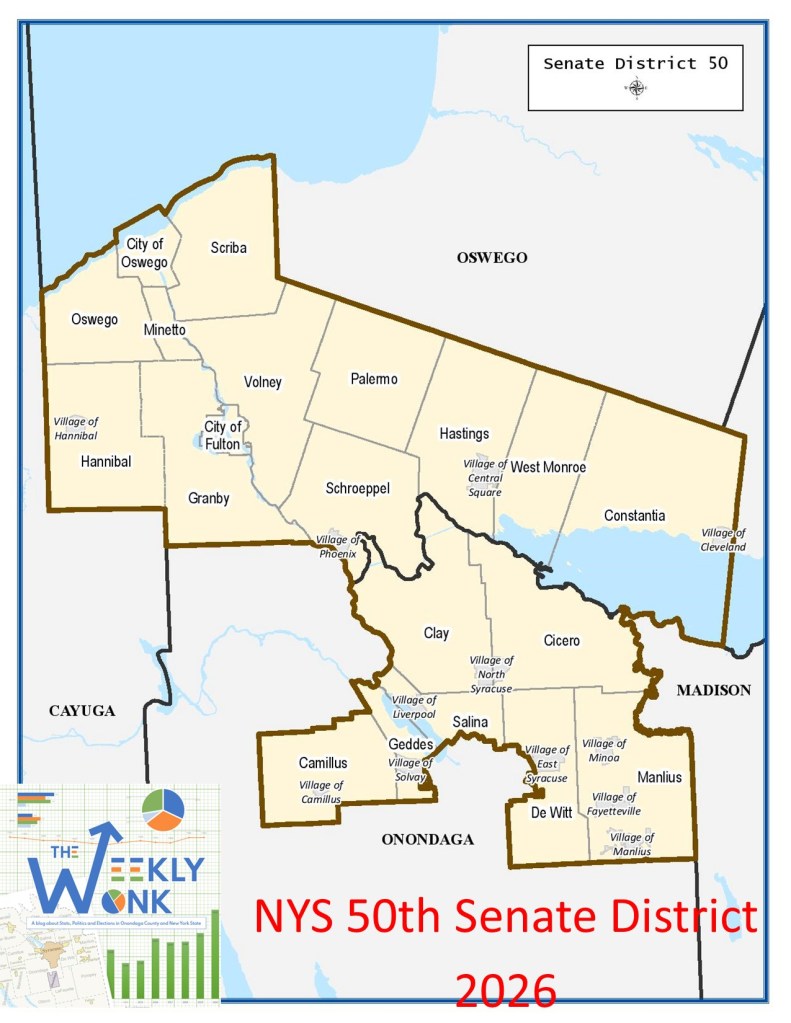
The current makeup of NY 48th has 193,989 active registered voters as of February 20, 2026. 72,816 (37%) are Democrat and represent the plurality. In a telltale sign of a Democratic dominated district the non-enrolled are in second place with 55,811 (29%) voters. The Republicans are in third place with 53,777 (28%) voters. Rounding out the district are Other (6,708 3%), Conservative (3,633 2%) and Working families (1,244 1%). The district consists of three distinct sections. The City of Syracuse has 36% (69,986 voters) of the district. The south and west portions of Onondaga County make up the largest portion at 39% (75,539 voters). The entirety of Cayuga County is in the district and makes up just 25% (48,464 voters) of the district.
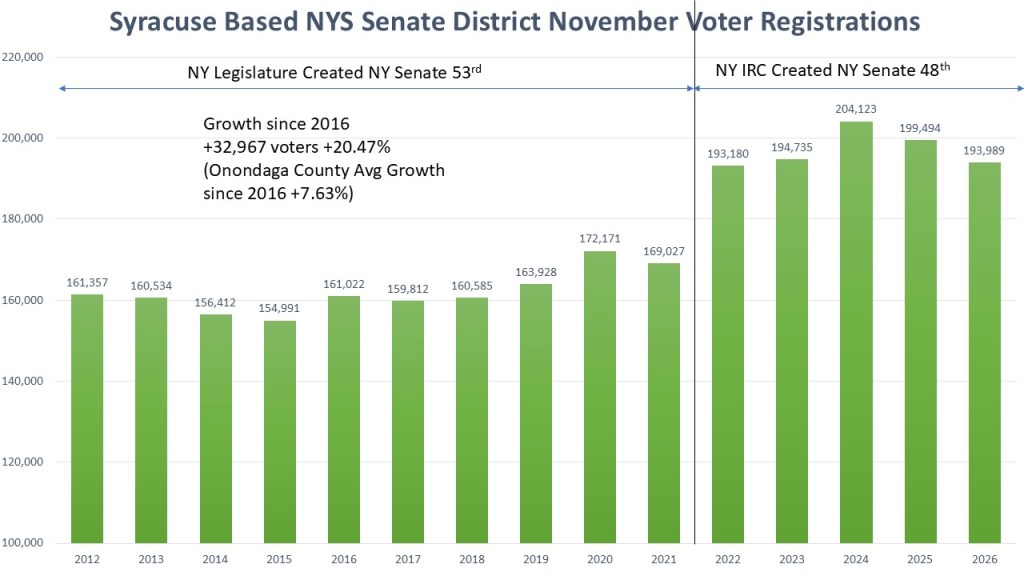
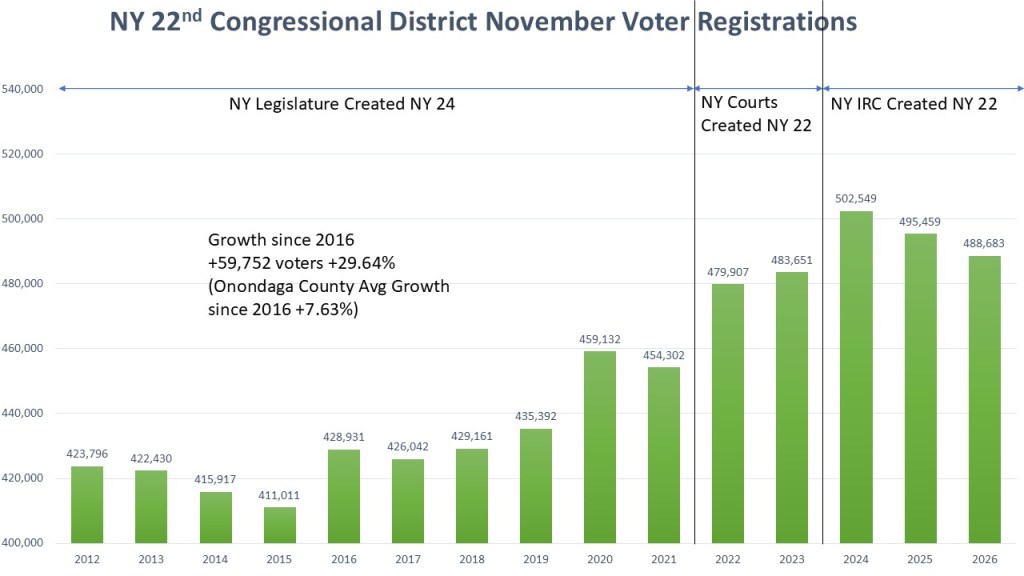
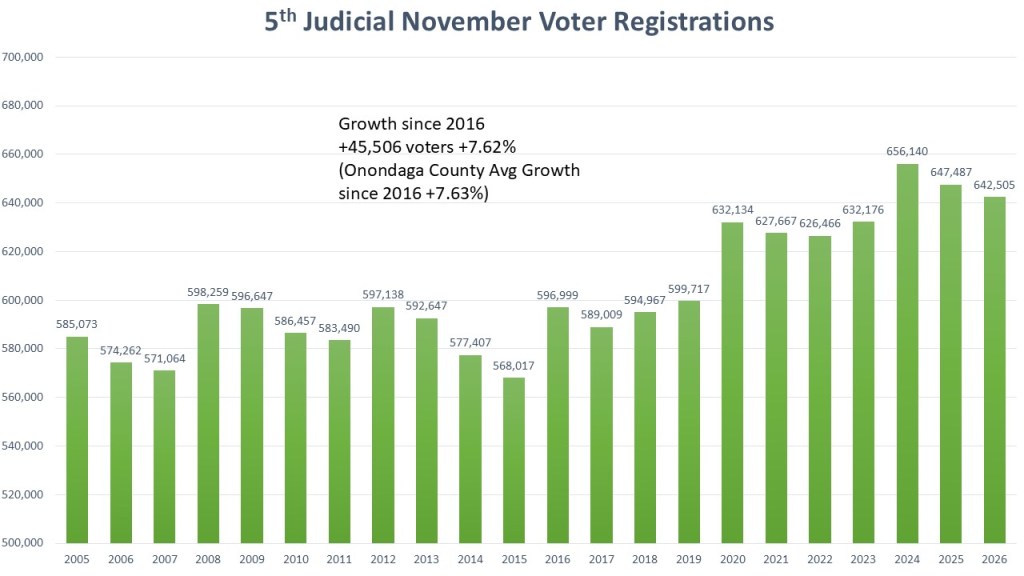
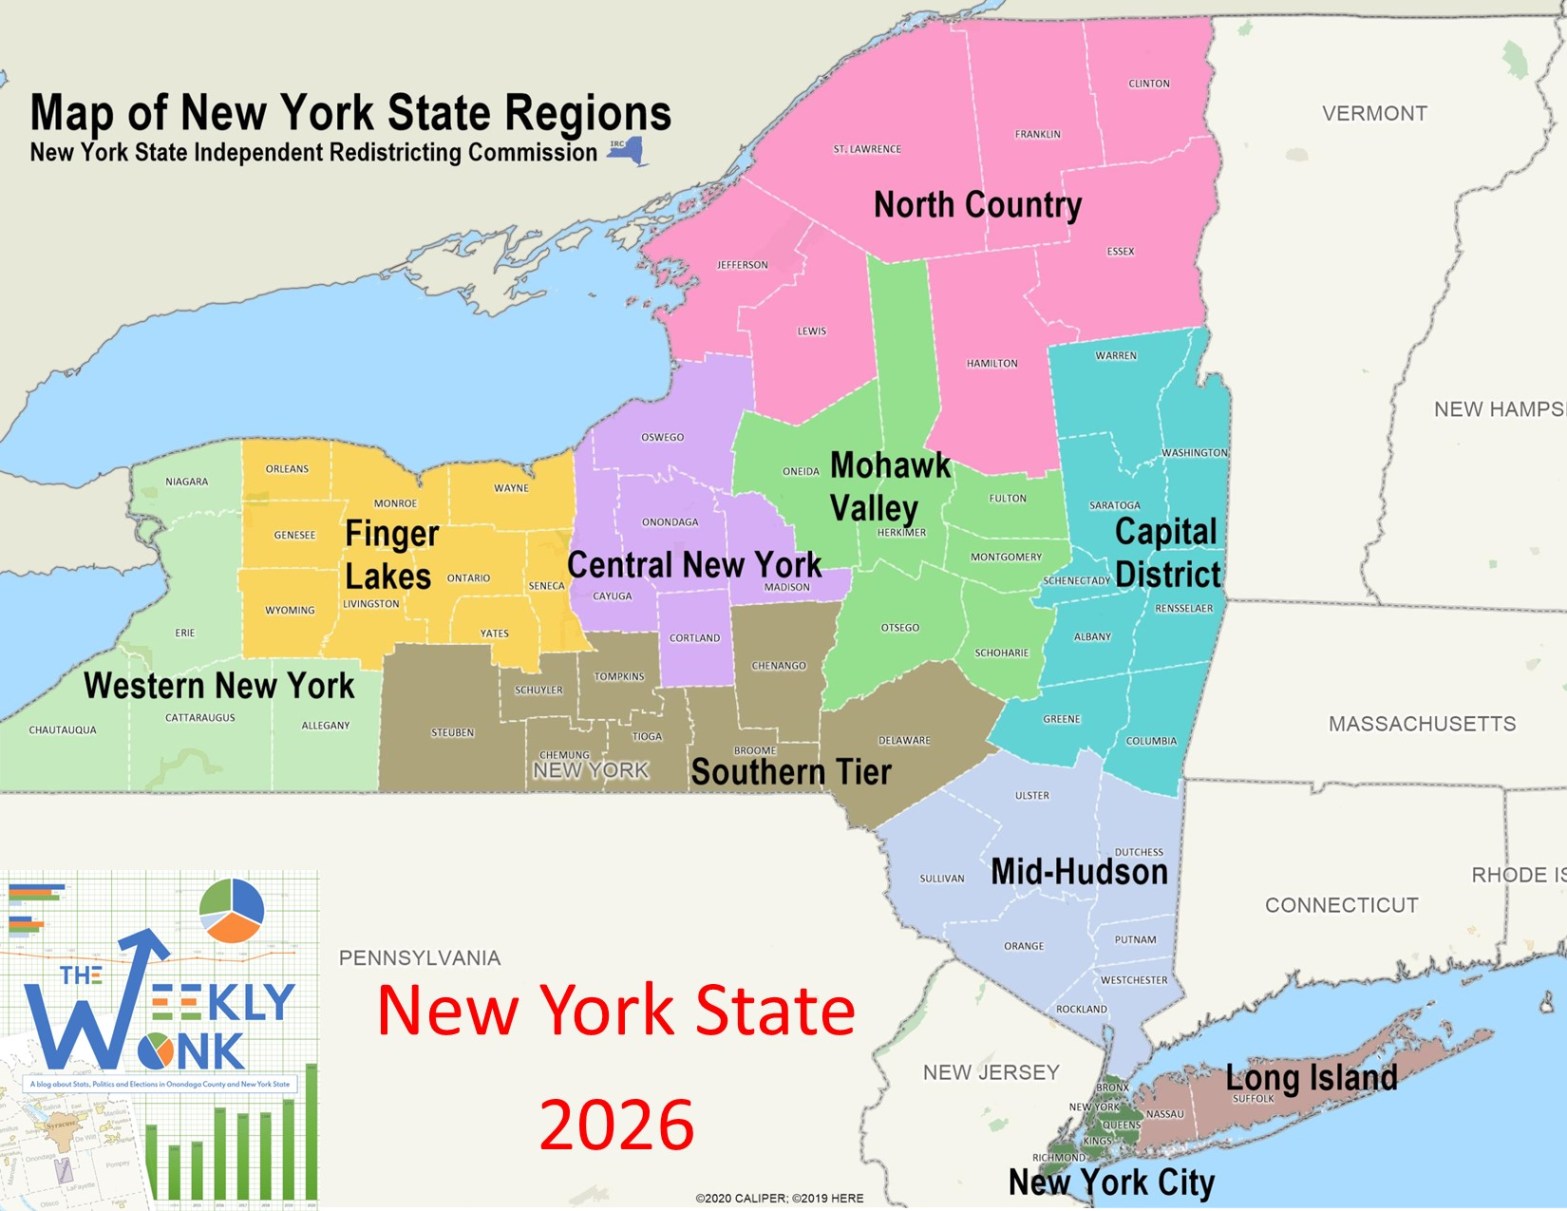
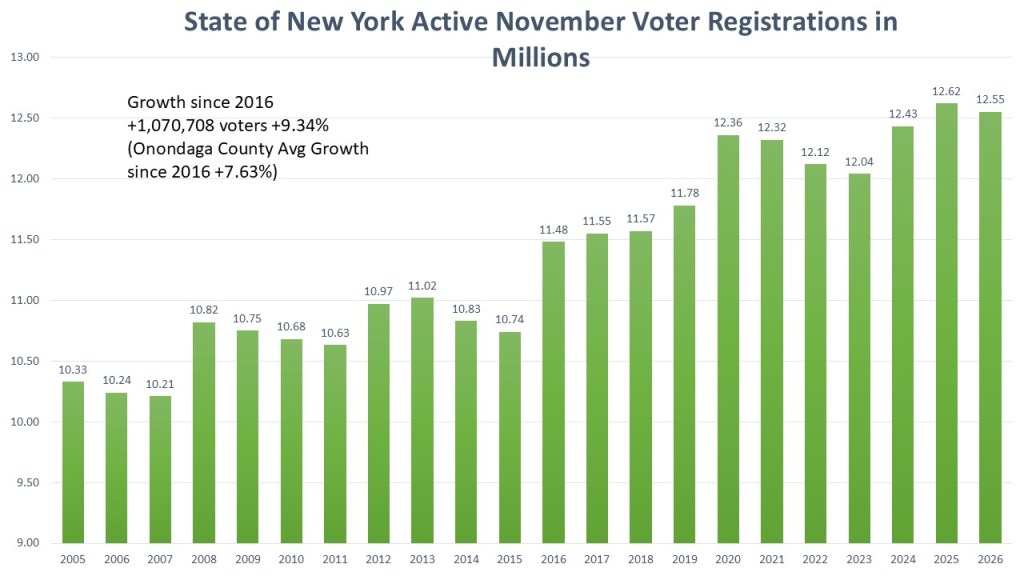
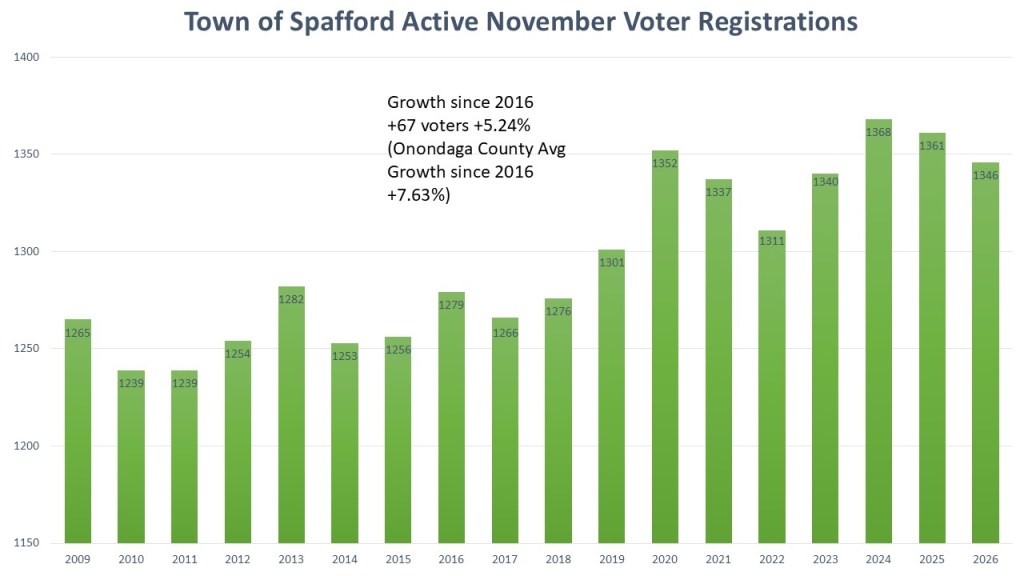
Like other districts in New York that we will examine, redistricting has played a significant role in shaping this district over the past decade. The district in Syracuse underwent significant changes because of the 2022 redistricting process. Under previous versions the district spread north and east from Syracuse into Oneida and Madison County. However, the so call NY “Independent” redistricting Commission flipped the Onondaga County Based districts, and the Syracuse based one went South and west through Onondaga County and have all of Cayuga County. Though perhaps the biggest change was the number of voters in the district. A new redistricting law mandated equal districts throughout New York State, ending the practice NY Republicans used to keep their shrinking majority bey having upstate districts have fewer voters in it. We see that in the big jump in population after redistricting. This is why the district has added 32,967 voters since 2016, a growth of 20.47% way larger than the Onondaga County average of +7.63%.
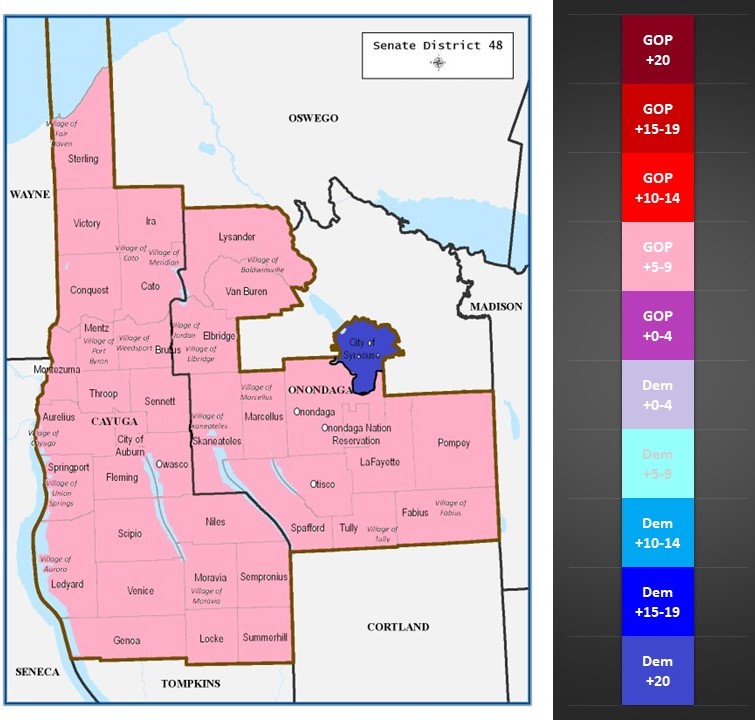
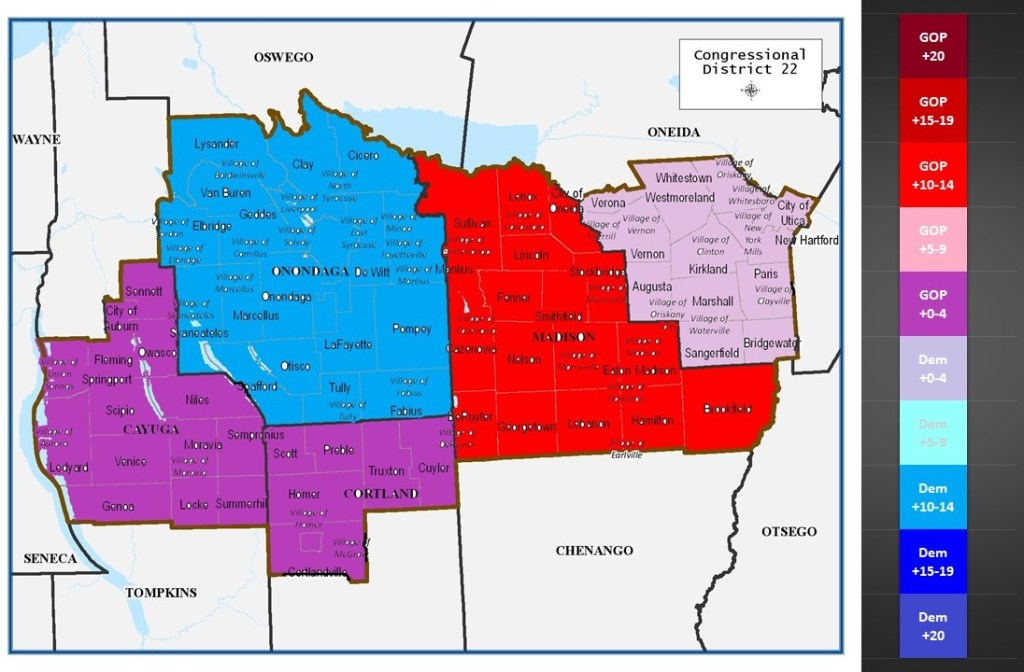
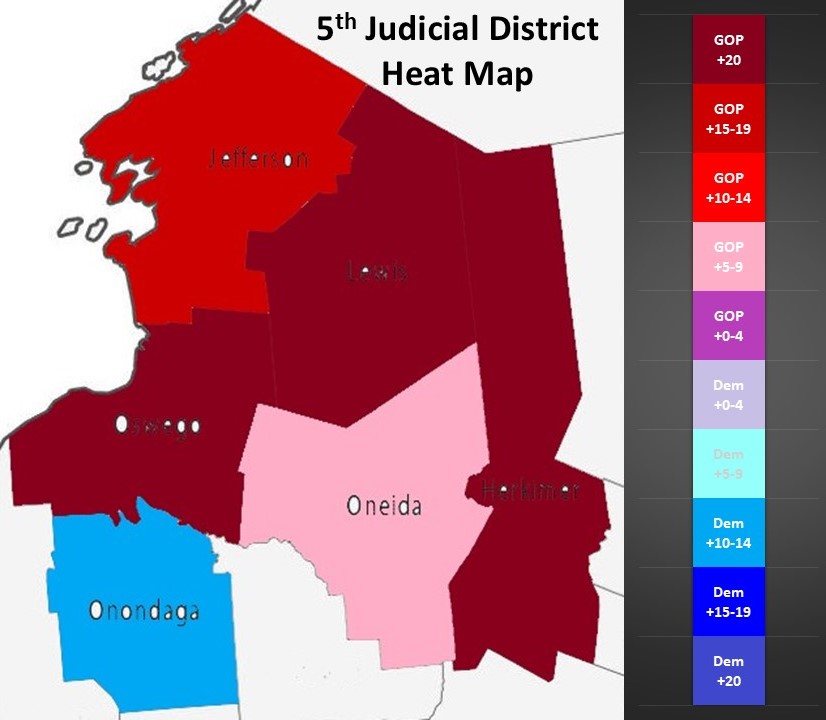
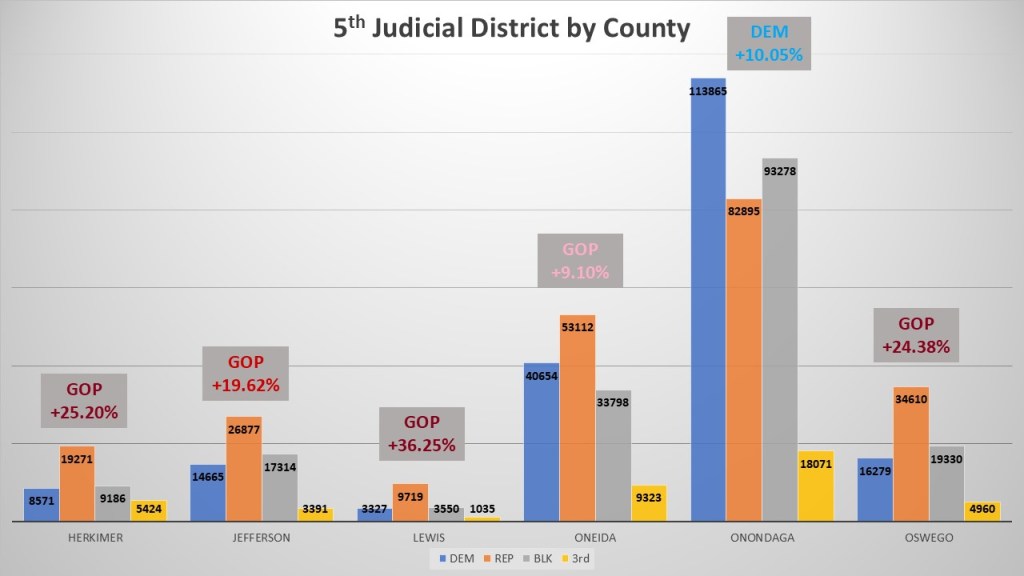
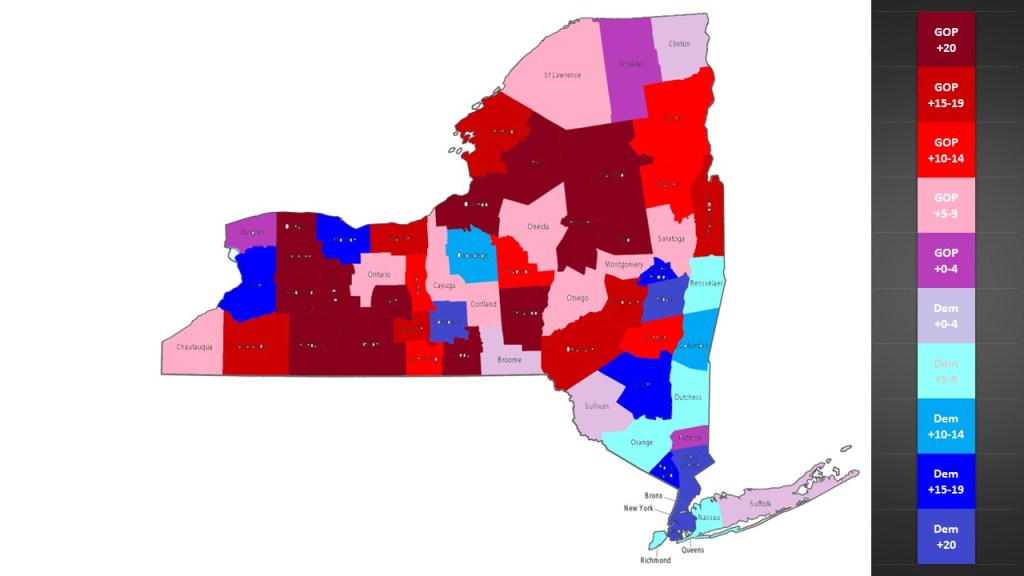
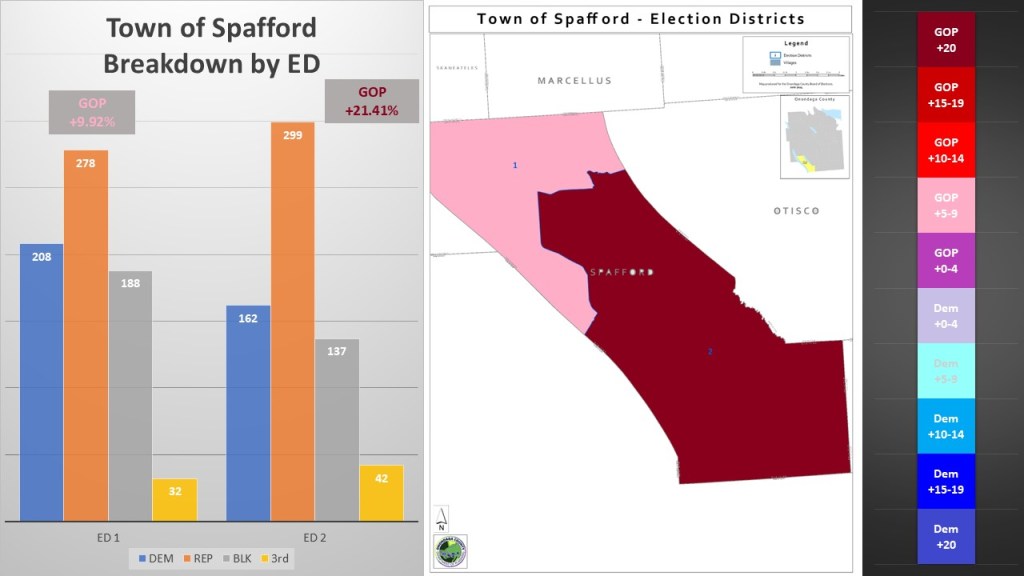
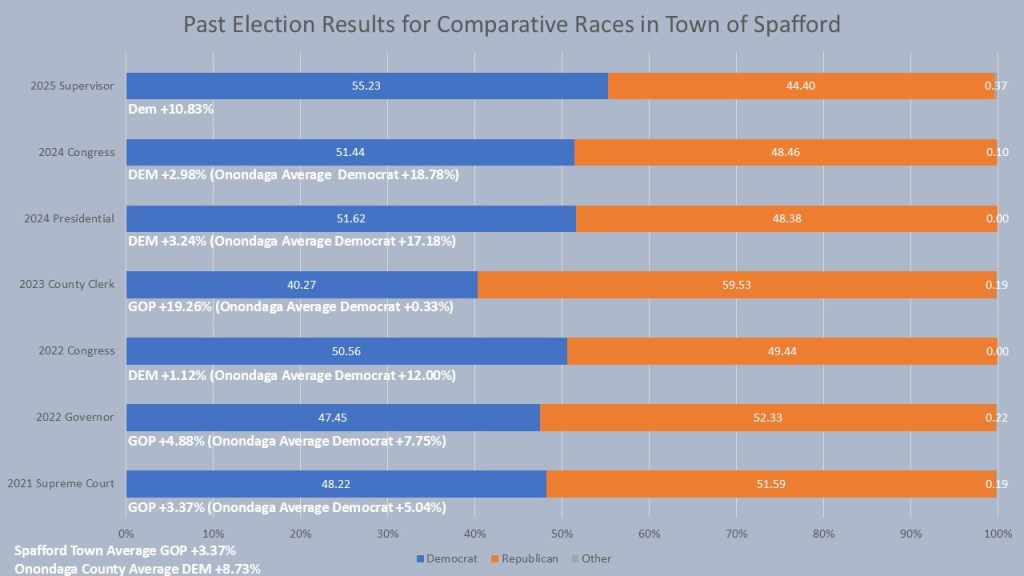
The three portions of the 48th district show one of the major dynamics of the district. We see the highly dense City of Syracuse with an overwhelming Democratic lean of over +20%. The rest of the district does lean GOP, but not overwhelmingly so. The remaining Onondaga County portion is in the GOP +5-9% category. The same with Cayuga County which is also in the GOP +5-9% category. While there are towns better than others and the City of Auburn slightly tilts blue on its own, the story of this district is clear. Can the City of Syracuse continue to exert dominance over the rest of the district?
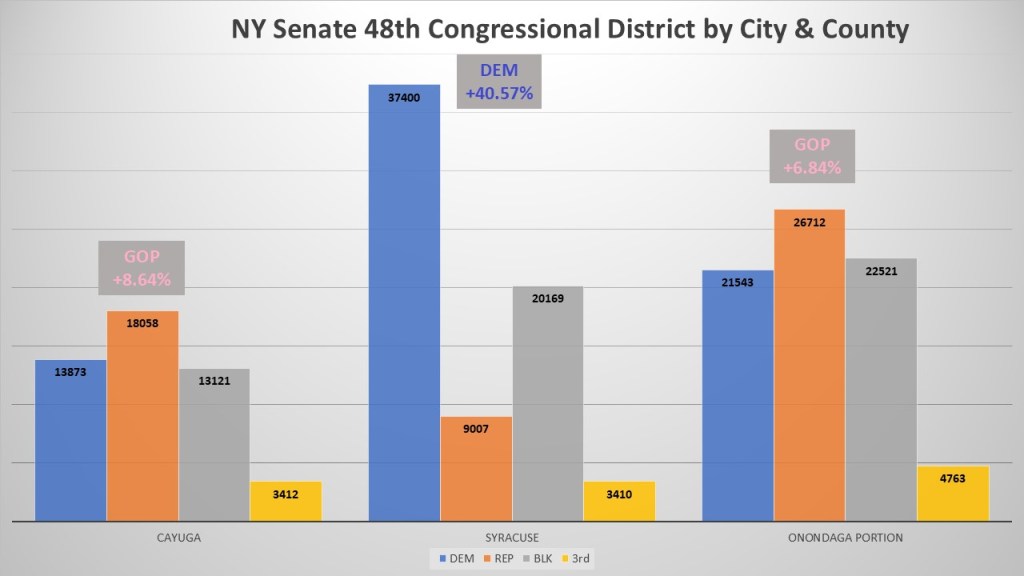
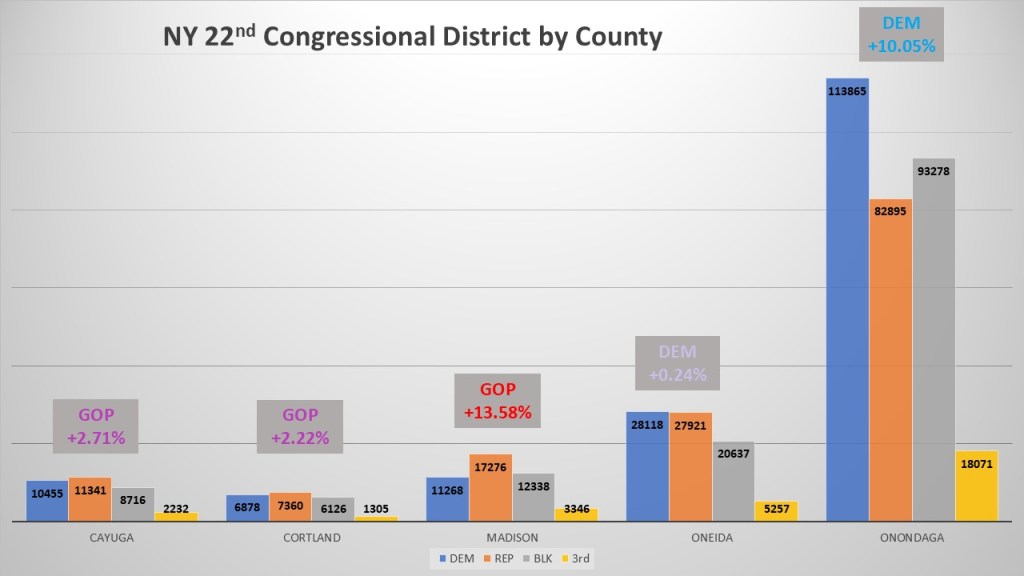
The voter breakdown of the city and county portion also buttresses that story. Democrats dominate the City of Syracuse at +40357% but the non-enrolled are also more than double the GOP. The rest of the Onondaga County portion we see the Gop have a plurality at +5.84% and the non-enrolled slightly outnumber the Democrats. Cayuga County is in between the two, Republicans have a higher percentage advantage at +8.64% but Democrats, barely, outnumber the non-enrolled.
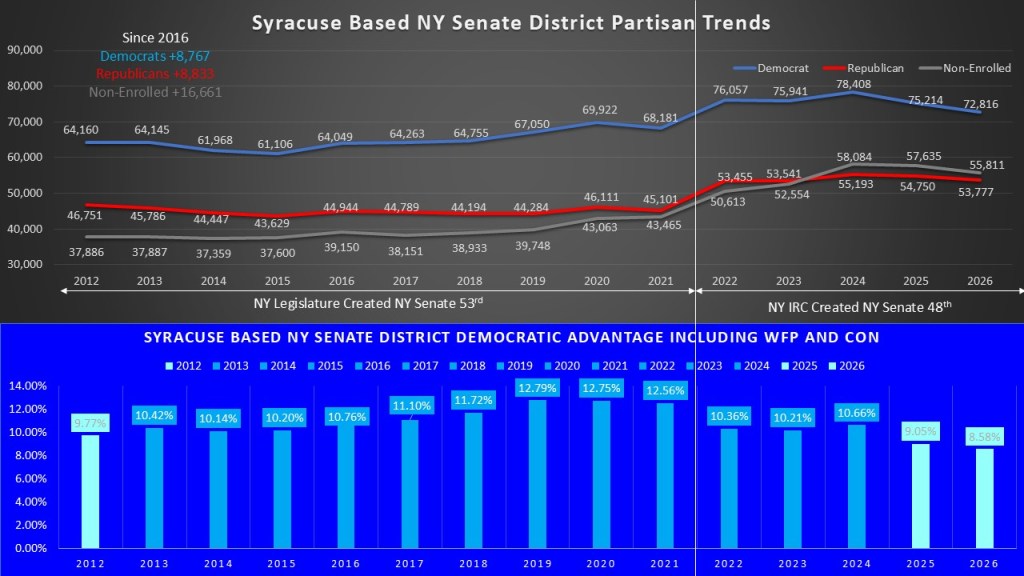
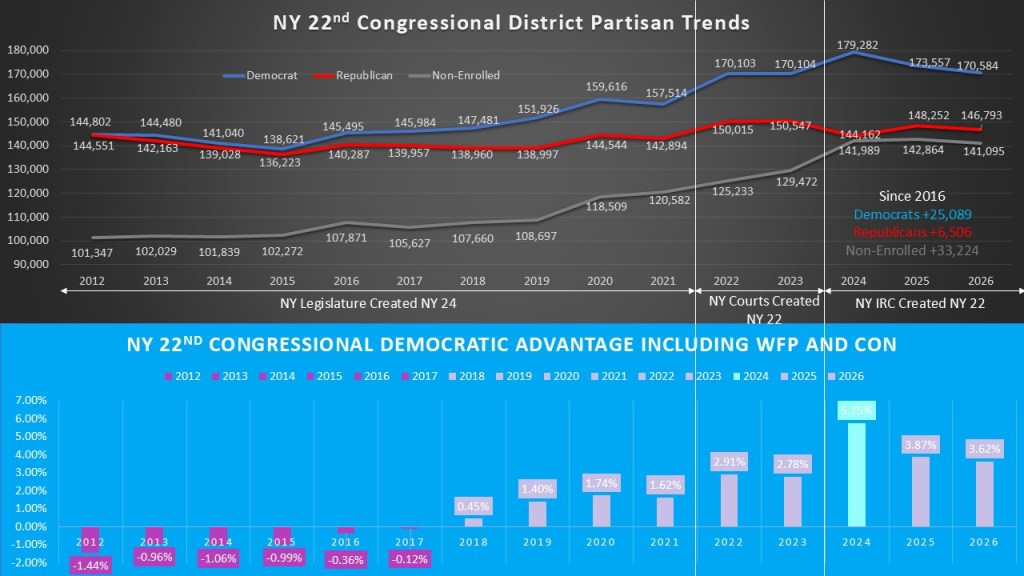
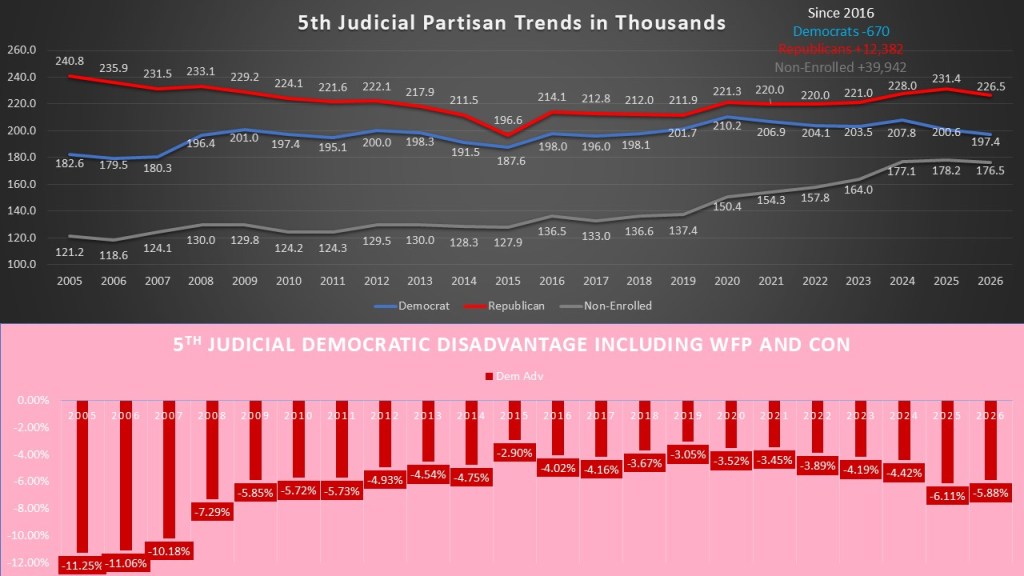
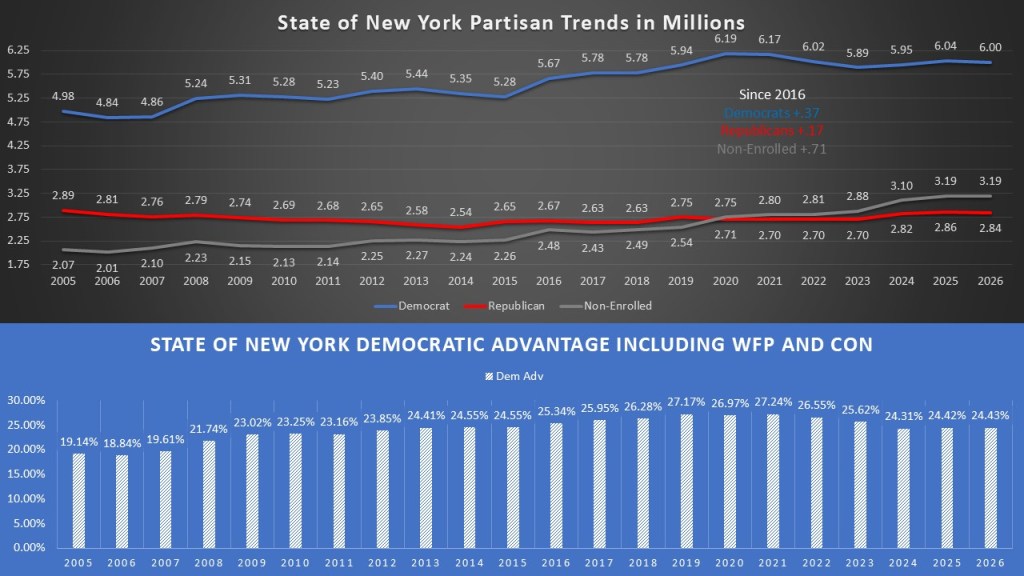
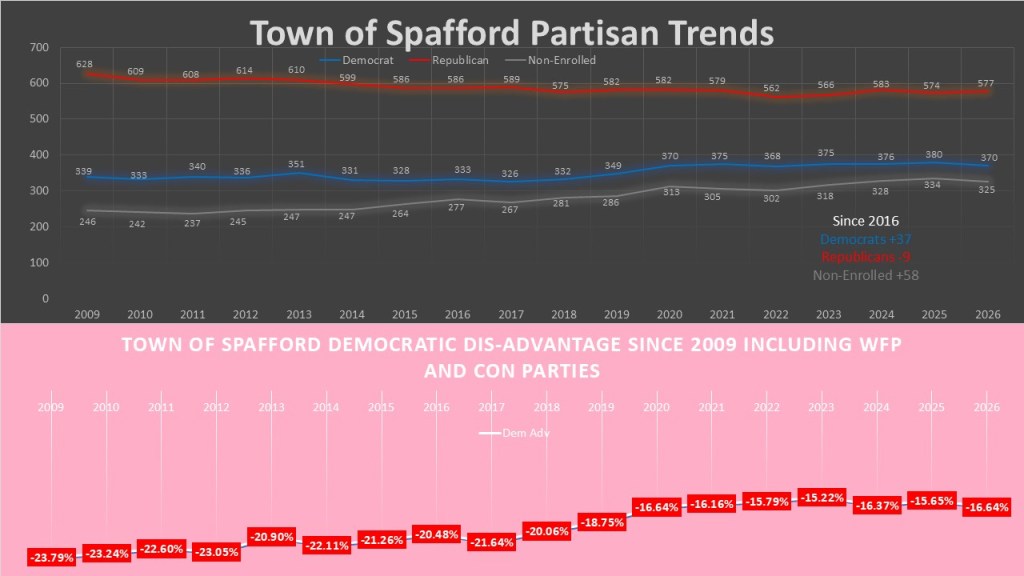
When we look at the partisan trends of the district, we really see the effect redistricting has on the district. Despite a big swing in geography, the district is near the same in makeup. But there are slight differences. Since 2016 Democrats have added 8,767 voters and Republicans have added 8,833 voters. This was mostly after redistricting in 2022. However, the non-enrolled is the big gainer, almost equaling both parties together at +16,661 voters. In fact, the non-enrolled, due to the influence of Syracuse, grew more than the GOP in 2024. When we add in the conservatives and Wp to see the ideological bend of the district, we see there was a drop after redistricting, and a small regression since 20224. However, that is because urban areas tend to fluctuate the most between Presidential elections. Still the non-enrolled are the key to this district now more than ever.
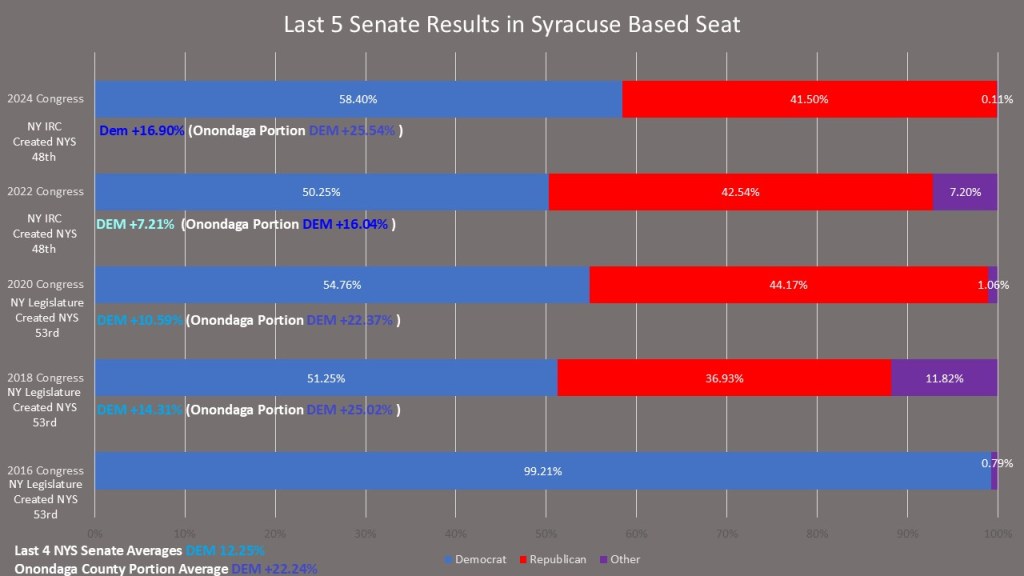
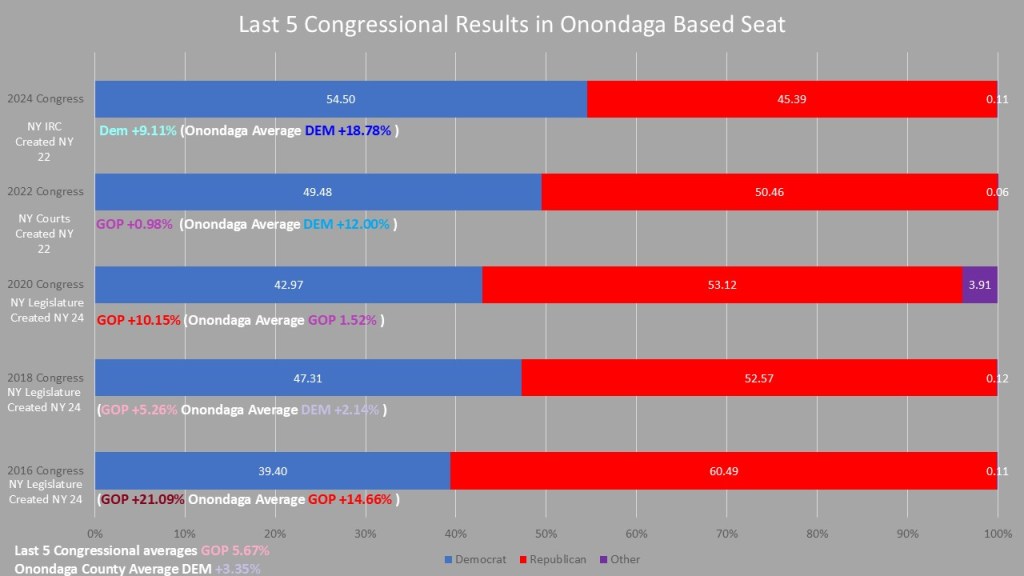
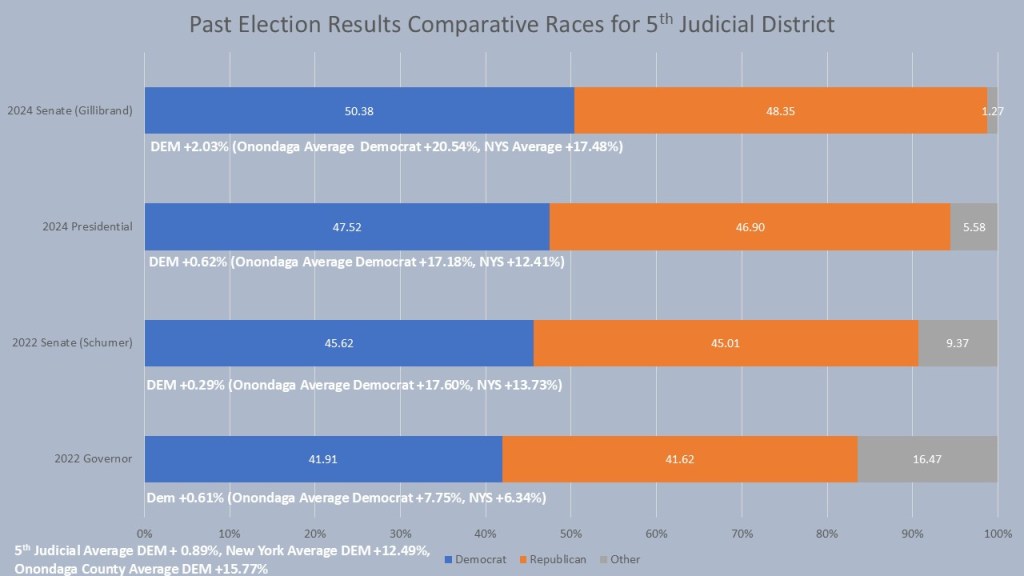
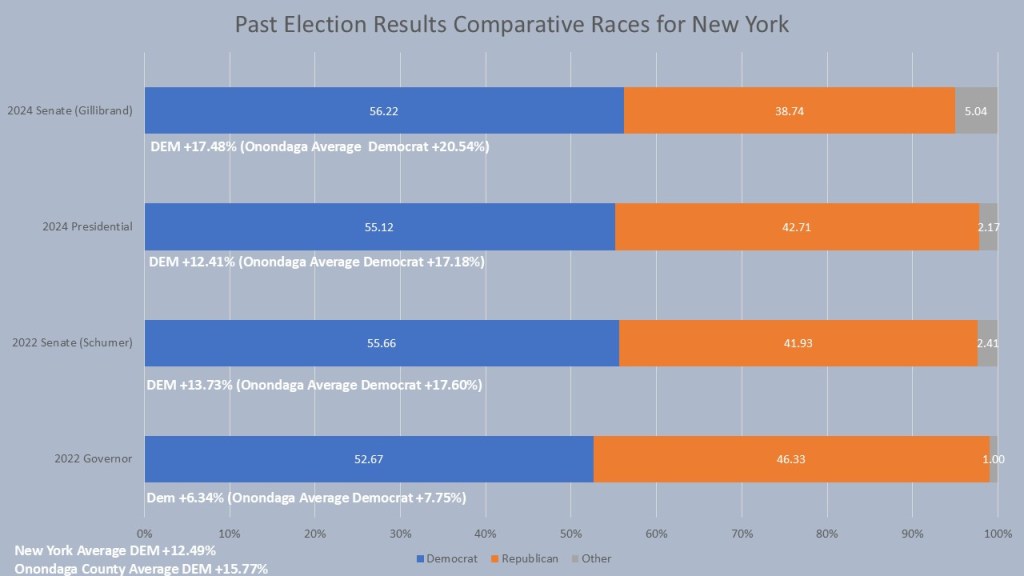
Finally, without the ability to get comparison races that span the entire district because of the radical redistricting in 2021 we are going to look at the last five elections. In 2016 Dave Valesky because of his connections to the IDC and NY GOP caucus had his third straight non-contested election. In 2018 Rachel May beat Dave Valesky in the primary but Valesky remained on the ballot because NY laws about third parties not allowing him to drop off. She easily won election by 14.31%. In 2020 Rachel May won re-election by 10.59%. The closest election was the year after redistricting. One of the worst years for Democrats and a brand-new district had Rachel May only win by 7.21%. Although she was already likely to win a tight race, a third-party conservative candidate also helped her secure victory. In 2024 though Rachel May bounced back with her biggest win at +16.90% after the newer part of her district got to know her during the last ter. It is the Onondaga County portion of the district that consistently votes for May. Rachel May has won her last four elections by +12.25%, but won the Onondaga County portion of the district, including Syracuse by an average of +22.24%.
That is, it is for this week’s edition of the #weeklywonk. Next week I set my sites on the other Senate District in Onondaga County, the suburban based NY Senate District 50. This district fell into Democratic hands in 2020 after generations in Gop hands. We will look at the data as Senator Chris Ryan runs for re-election this year. As always, you can subscribe to Dustinczarny.com to get content and election news updates.