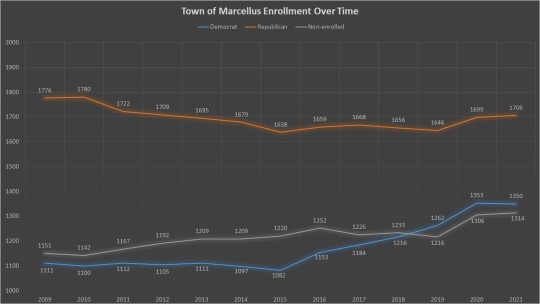
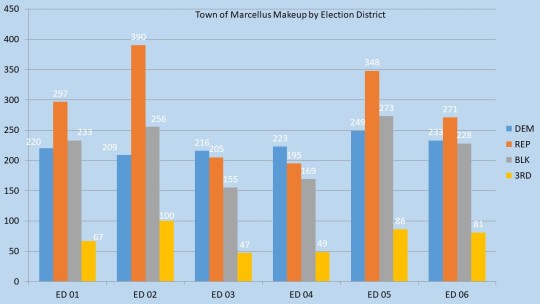
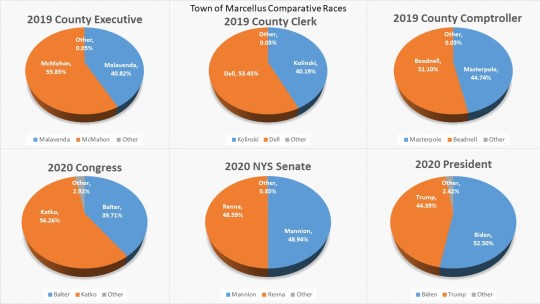
Welcome back to Wonky Wednesday. Each week I do a deep dive into the election and registration data that makes up the electoral landscape of our home, Onondaga County. I hope by looking into this data we can glean that this everchanging county is not monolithic as once thought and competition for Democrats, and all registrations, can be found everywhere. This week I take a break from the march through our towns to look at the Onondaga County Board of Elections Annual Report released last week.
Every year Election Law requires each Board of Election in New York State to prepare a written Annual Report. This report is distributed to each County Legislator, the County Executive, the County Comptroller, and posted on our website at onvote.net (under Election Regulations). We prepare the report in April of each year after the County closes its fiscal year. The report touches on just about every part of our mission to serve the voters of Onondaga County. In its pages you will have data on staffing Budgets, and election statistics.
Today’s Wonky Wednesday I will dive into a few highlights from the report that was not covered earlier this year with my post 2020 wrap up series. Previously I did Wonky Wednesday posts on Early Voting, Absentee, Affidavit and Court Orders, as well as 2020 Turnout. Today I will be highlighting some statistics from our Budget Performance, Staffing Levels, Workload, and I will be providing some stats not included in the Annual Report on Commissioner Salaries in Onondaga County.
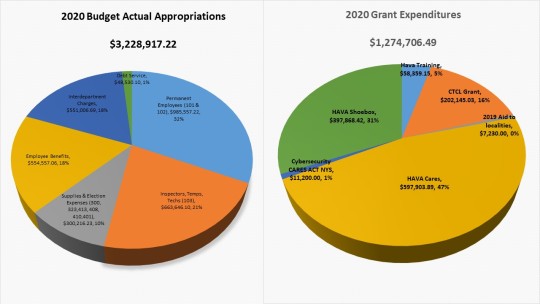
The 2020 local Budget for Onondaga County consisted of $3,228,917.22. This is the total impact of dollars on Onondaga County residents. The major expenditure categories are Permanent Staff (the 14 full time employees and 2 Commissioners) at 32%, Temporary and Season Employees (Techs and Inspectors that work the poll sites) at 21%, Employee Benefits for the Permanent staff at 18%, Interdepartmental Charges (charges from other county departments) at 18%, And Supplies at 10%. The OCBOE Commissioners submit budget requests for everything but the Benefits and Interdepartmental charges. Those portions of our budget are controlled directly by the Office of Budget and Management.
In addition to the local budget Onondaga County Board of Elections spent $1,274,706.49 in Grant Expenditures. This is where the OCBOE found State, Federal, or private Grants to offset local dollars. This effort to utilize grant money by the OCBOE kept our Department from going over budget in a year where COVID-19 created tremendous burdens on county budgets and Board of Elections throughout the nation.
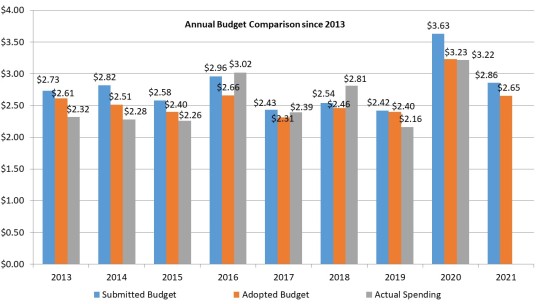
The overall budget is looked at in three stages. The OCBOE submits a budget to the County Executive and County Legislature based on our experience in what we need to spend in an Election Year. The County Executive and Legislature then alters the budget and finally adopts it. Finally, the OCBOE tries to expend local dollars below both the Adopted and Submitted budgets. However, we have a mandate at the Board to spend what is needed to cover state and federal mandates to service the voters for an election.
In 2019 then County Comptroller began a year long attack on the OCBOE for being irresponsible and “blowing our budgets”. This led me to start compiling historical data on our budgets going back to my first year as Commissioner. There were only two years where the OCBOE failed to keep expenditures below our submitted budget 2016 & 2018. The historic nature of the turnout in those elections is the direct cause for those discrepancies. In both years, the turnout broke expected levels. In 2017 we were under our submitted budget but over the cuts made by the County Executive and Legislature. In that year we also had historic turnout for a mayoral election which helped drive up costs. However, in all three years the much of the reason for going over budget was beyond the OCBOE control.
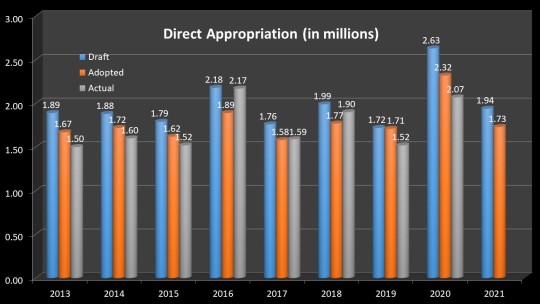
In these two slides you see the Direct Appropriation Spending as well as the Interdepartmental spending. As I noted earlier the OCBOE only has control of certain portions of our budget. This is all under the Direct Appropriation label. In the three years we went “over-budget (2016, 2017, 2018) our direct appropriation, the spending controlled by the BOE, was under our submitted budget amounts, though over the cuts made at the legislature. In fact, at my time at the BOE we have never spent more than our submitted budget request.
Where the budgets went over was in the direct appropriations. Again, this portion of our budget is created and controlled by the Office of Management and Budget. We have no control over the spending or creation of this budget. None of this nuance was shared by then Comptroller Beadnell in his many public attacks on our department.
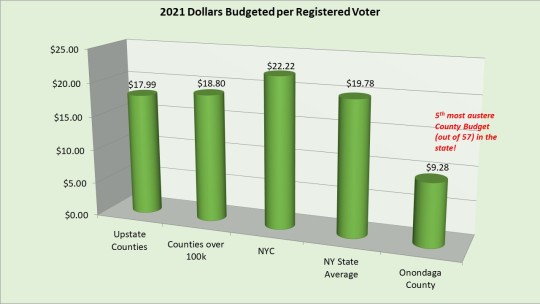
The austerity of the Onondaga County budgets is most noticed when comparing to the other counties. In 2021 that austerity continues. Our adopted budget of 2.8 million is 10th highest of upstate counties, but we have the 6th highest registered voter population. The proportional proposed spending of $9.28 per voter is the 5th worst in the entire state and way below the average of $17.99 per voter for all Upstate Counties and $18.80 per voter for counties over 100k.
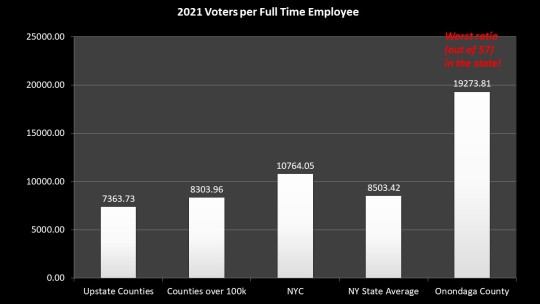
The main source of this inequity comes from the refusal to add permanent staff to our department. Despite all the Election Reforms passed and the dramatic increase in workload we are at the same staffing levels that we had when we started in 2013. The 14 full time permanent staff represent 1 full time staffer to every $19.2k voters. Throughout Upstate New York the Boards of Elections average 1 full time staffer for every 7.3k voters, Again Counties over 100k voters average 1 for every 8.3k voters. Even if the County adopts my proposal for 2021 to add 4 full time permanent staff, an increase of over 25%, we still will have the worst ratio in the state.
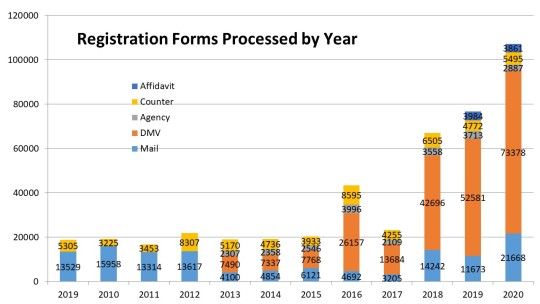
The workload has dramatically increased over the last 4 years. In addition to the 500% increase in absentee ballots in 2020 we saw a record-breaking registration level. New York State reforms that make it easier to register and update registrations through DMV have been vital to our increased turnout, but that fallout is an ever-increasing workload. We processed over 100k registration forms in 2020 with 73k from DMV. This is part of an ever-increasing traffic that we have seen since 2016 when the DMV started allowing online registration changes. This added workload along with no additional staffing has resulted in weeks of 12-hour days to avoid issues like we saw in Oneida County last year. The human cost of this is starting to show as we are getting some burnout and turnover each election now.
Finally, I wish to address the controversy last year with the attempted reduction in my fellow commissioners and my salary. I feel honored to be one of your Elections Commissioner and I recognize that to many in our community our salaries of $99,973 annually would be a blessing, and it is for me as well. I hope that you can see from the amount of personal time and effort I put into this job that it is not a 40 hour a week 9-5 job for me. Commissioners do not receive overtime and often work 50-60 hour weeks during Election Time and as you can see from the workload and new calendar throughout the year. However, the attempted reduction in our salaries was justified both on the floor and in a release by the GOP legislators with faulty math to justify their hasty and last-minute decision.
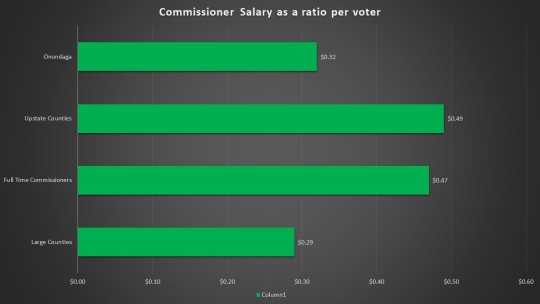
Onondaga County is the 6th most populous county in New York outside of NYC. Our salaries are the 7th highest. In all the counties the state average I the Commissioner makes about $.49 per voter, we in Onondaga County only make $.32 per voter. 41 of the 57 counties have full time commissioners, they average $.42 per voter. Commissioners of Larger counties usually make less per voter since they have additional staffing to compensate to spread out the workload. As we saw in the last section Onondaga County is the least staffed County in the state per voter. Even so Onondaga County’s rate is comparable to the $.29 average. This ratio will get worse over time now that the County Legislature has exempted us from annual cost of living pay raises, something every other Department Head in the County benefit from, including themselves. It is up to others to speculate on the motivation, but the math doesn’t add up.
I hope this analysis shows you the hard work and dedication of all our staff at the Onondaga County Board of Elections. Despite the inequities placed on us the staff is committed to not only providing basic services but are a leader in Election Administration throughout the state. I could not be prouder of them and I will continue to work to make sure these inequities are highlighted, and hopefully resolved, in the future.