This week is a special Commissioner in a Car from the bowels of the legislative office building in Albany. I take a break from my educational day in Albany to talk about the status of hearings this week at the OCBOE Also we still await the budget in Albany and what it might mean for Boards of Elections throughout the state.
(video breaks up but audio is there. Sorry about the quality.)
Subscribe to dustinczarny.com for all content and election news updates
(In addition to our 2023 Legislative priorities, the Democratic Caucus of Commissioners are often asked to weigh in on Election related bills by members of the NYS Senate and Assembly. Here is a list of bills that our caucus has decided to support and hope are passed before then end of the 2023 session. More bills and support memos will be added over the next few weeks.)
S4496 Requires the boards of trustees of SUNY and CUNY institutions to grant course credit to students who serve as election inspectors, poll clerks or election coordinators. Read our Memorandum of Support
S371/A2633 An act to amend the election law, in relation to enacting the “democracy preservation act”; and in relation to prohibiting contributions by foreign-influenced business entities and requiring certification. Read our Memorandum of Support
S438/A928 An act to amend the election law, in relation to requiring electors to vote for the presidential and vice presidential candidate who were nominated by the political party that nominated the presidential elector. Read our Memorandum of Support
S945/A4072 An act to amend the election law, in relation to making technical corrections thereto.
S2298/A1176 An act to amend the election law, in relation to requiring that subpoenas relating to election matters be served with a separate informational sheet that summarizes why the subpoena has been issued
S2349A An act to amend the election law, in relation to providing that a voter may register to vote at any residence to which the voter maintains a continuous connection with an intent to remain.
S7046/A3291 Makes the expansion of absentee voting provisions permanent.
A3250/S6735 Pre-registered 17 yr old request absentee ballot.
S2381/A5007 Relates to enabling constitutionally qualified electors to register to vote and to cast a ballot on the same day at a polling location.
S6195/A1177 Relates to ballots submitted in envelopes that are sealed with tape, paste or any other binding agent or device and have no indication of tampering.
A1127 Eliminates the ability of judicial candidates for office who are enrolled in a particular party to automatically be allowed to run as a candidate in another party’s primary election
S1733/A5180 Establishes a school voter registration access program
S242/A6971 Establishing portable polling places for Early Voting
S585 Allows NYS Board of Elections to remove Elections Commissioner for cause
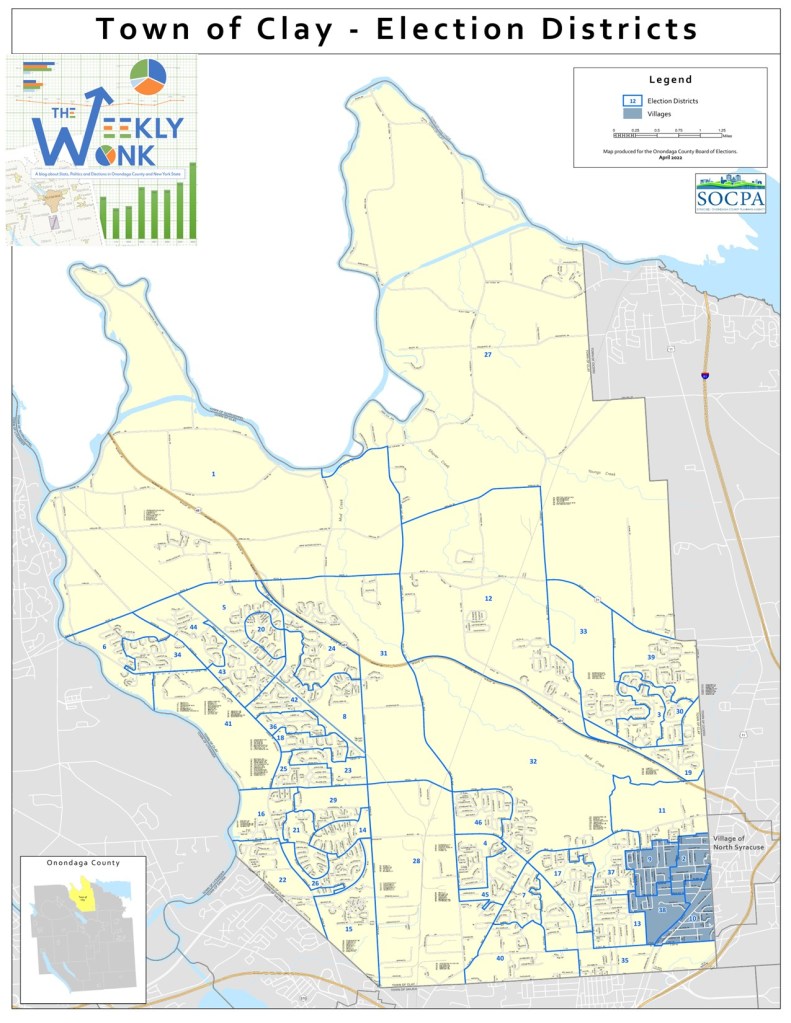
Welcome back to #WeeklyWonk. Each weekend I publish an article on a subject relating to elections in Onondaga County and New York State. Often these articles will have detailed stats to consume but sometimes they will be a recap of a prominent issue or on relevant election law. I am turning my eye to the 2023 elections. Today I investigate the Town of Clay, the largest Town in Onondaga County.
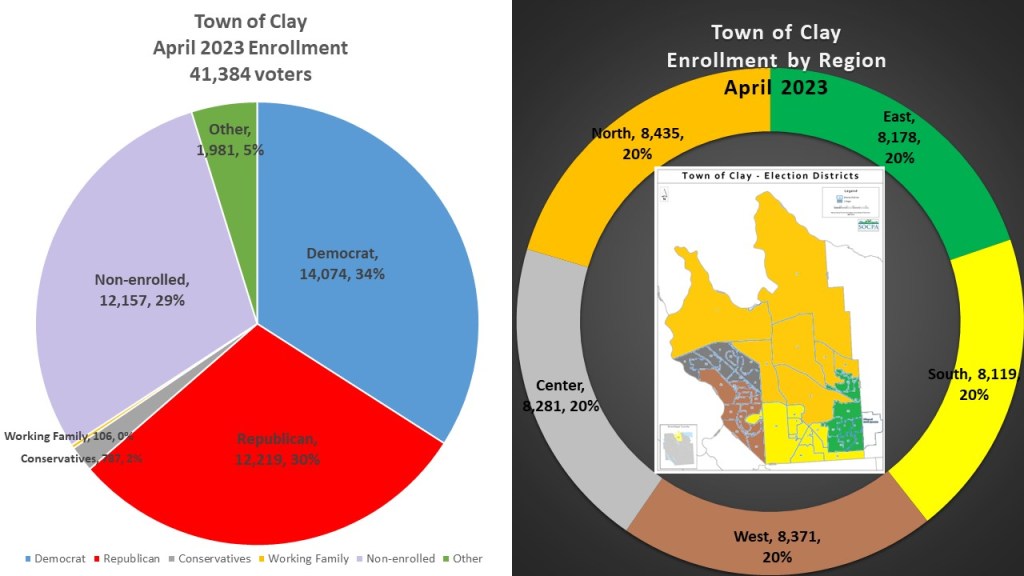
The Town of Clay sits in the true north of Onondaga County in between Lysander to the west and Cicero to the East. The makeup of Clay is 34% Democrat (14,074 Voters), 30% GOP (12,219 Voters), and 29% non-Enrolled (12,157 voters). Democrats have carved out a small but sustained plurality in Clay. Clay elects all their representative’s town wide and not by wards. So, I have carved up Clay into 5 different regions, North 8,435 voters, Center 8,281 voters, West 8, 317 voters, South 8,119 voters, and East 8178 voters. Each region represents about 20% of the electorate of Clay.
In a new feature I am bringing to the #weeklywonk this year I am doing a heat map for each political subdivision. I will be looking at the current partisan makeup of each individual ED and heat mapping its partisan lean based on the advantage for the Democrats and GOP. We see a wide variety of partisan leans in these eds. Ed 27 has an overwhelming GOP advantage (+20% GOP). Ed 12 has a normal GOP advantage (+5-10% GOP). Most of the area of Clay exists in the borderline eds. Eds 1, 3, 7, 16, 19, 32, 33, 37, 46 have slight GOP advantage between 0-5%. Eds 4, 5, 8, 13, 14, 17, 18, 29, 35, 40, & 44 have slight democratic enrollment advantages between 0-5%. A significant amount of Eds though live in Democratic leaning areas. Eds 2, 6, 10, 20, 21, 24, 30, 31, 34, 36, 38, 41, & 43, have normal Democratic advantages (5-10% Dem). Ed 15 has an overwhelming Democratic advantage (+20 DEM).
Since 2009 The Town of Clay has seen the typical suburban partisan shift going from a small GOP advantage to a consistent Democratic plurality. Democrats have gained 1,969 voters. The GOP has stalled losing only 210 voters. The Non-enrolled has seen the largest gains, garnering 2,666 more voters. New voters in terms of age and transplants prefer the Democratic and Non-enrolled registration status as the older GOP population is holding steady, but not making any gains as the town grows.
The regions are mostly reflective of the purple nature of the overall registration. The center region is really the Center west consisting of compact suburban eds near the border with Lysander. This is a solid Democratic region with +4.88% partisan advantage. The Eastern region in the southeastern corner of clay with the communities bordering North Syracuse is +4.87 Democrat but the non-enrolled has eclipsed the GOP here. The northern eds are the larger more agrarian eds that make up the North and center portion of the towns and the more GOP leaning of the region with a -3.31 rating for Democrats. The Southern region bordering Salina is also a solid Democratic region with +4.05% Democrat and non-enrolled outnumbering GOP. The western region is the really the southwestern corner that considers itself part of the extended Liverpool community of Salina. This is the most Democratic region with +11.09 Democratic advantage and the non0-enrolled far outnumbering the GOP.
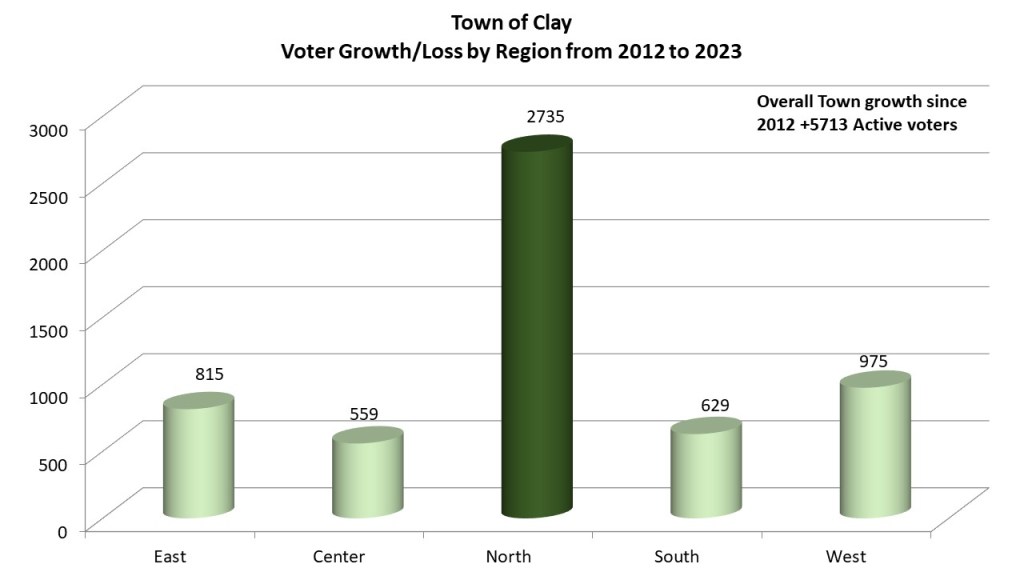
Looking at the growth of voters since the last redistricting cycle we compare it with date from May 2012. The Town of Clay grew by 5713 active voters. The biggest growth is in the northern region which gained by 2735 voters. This makes sense as it is the largest landmass region and where there is room for more development. The western region grew by 975 voters. The Eastern region grew by 815 voters. The southern region grows by 629 voters and the Center region by 559 voters. With Micron coming to Northern clay, we could see even more growth in the northern region as housing development may surround the industrial growth.
The Town of Clay Democratic advantage has grown by 4.61% since 2012, which is significant but behind the pace of Onondaga County overall. The largest growth has been in the western region with Democrats gaining by 7.43%. The southern region grew by 6.04%. The center region grew by 5.20%. The eastern region grew the least by just 2.16%. Democrats are seeing growth across Clay, but it seems to be concentrated mostly in the southwestern corner of the Town.
When we look at the comparative races, we see the hallmarks of a purple town in Onondaga County but a little more Center right. In even years Clay voted for President Biden in 2020 54.71% of the vote, 4.17% behind is Onondaga rate. However, in 2022 Governor Hochul lost Clay only getting 48.86% of the vote, 4.92% behind her Onondaga County rate. In odd years the GOP has done considerably better in Clay. In 2021 Anthony Brindisi for Supreme Court only garnered 43.74% of the vote, 8.76% behind his GOP rate. In 2019 Dan Kolinski for County Clerk only garnered 42.80% of the vote, 4.93% behind his Onondaga County rate. In the last head-to-head local race, the GOP won the Town Clerk race by over 30% points.
In 2023 the Clay Town Democrats will caucus to find candidates for Supervisor, Clerk, 2 Town Justices, 2 Town Board members and Highway superintendent. The Town of Clay Democrats fill their candidates by caucus. The Caucus has not yet been scheduled but can be anytime between now and July 27, 2023. If you are interested in running for any of these offices or want to help the Clay Democrats contact their chairperson Matt Jones at mjones4clay@gmail.com.
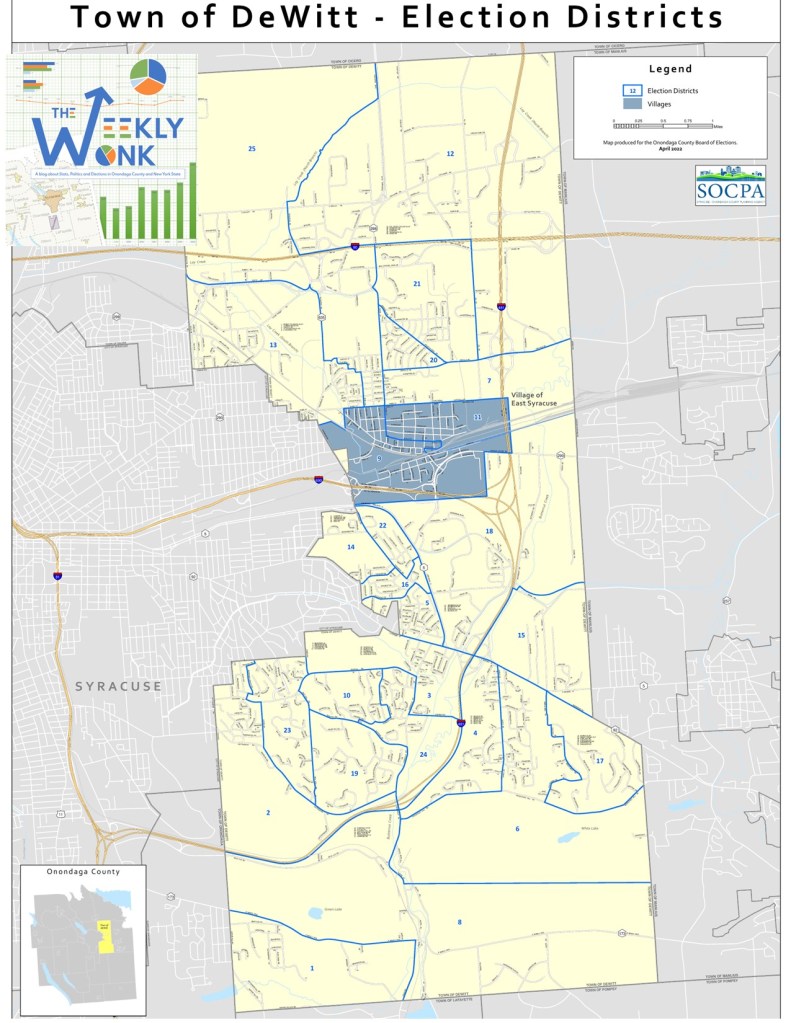
That is, it for this week’s edition of the #WeeklyWonk. Next week I will dive into the Town of Dewitt, the most reliably Democratic town in Onondaga County. As always go to dustinczarny.com and subscribe to get all your content and election news updates. I run that website, along with these series of articles, as part of my voter education. I never take ad money or charge subscriptions paying for the site with my own personal funds. Subscribe here.
I sit down with Paolo Cremedis and Giancarlo Llaverias of the Outrun Coalition. They are a group of Democrats focused on electing diverse Democrats in rural communities. They have an incredible record and a great perspective on doing the hard work to get people elected. Enjoy.
Subscribe to dustinczarny.com for all content and election news updates
Today I talk about the 9 (and counting) specific objections we have received at the OCBOE and the process for objecting to petitions. I also talk about the new New York Court of Appeals Chief Judge, The possibility of a NY budget coming soon, and the Dominion/Fox settlement. Enjoy.
Subscribe to dustinczarny.com for all election news and content updates
Welcome back to #WeeklyWonk. Each weekend I publish an article on a subject relating to elections in Onondaga County and New York State. Often these articles will have detailed stats to consume but sometimes they will be a recap of a prominent issue or on relevant election law. I am turning my eye to the 2023 elections. Today I look at the Town of Cicero, the largest GOP town in Onondaga County, and one of the more stable communities in terms of partisan registration over the last ten years.
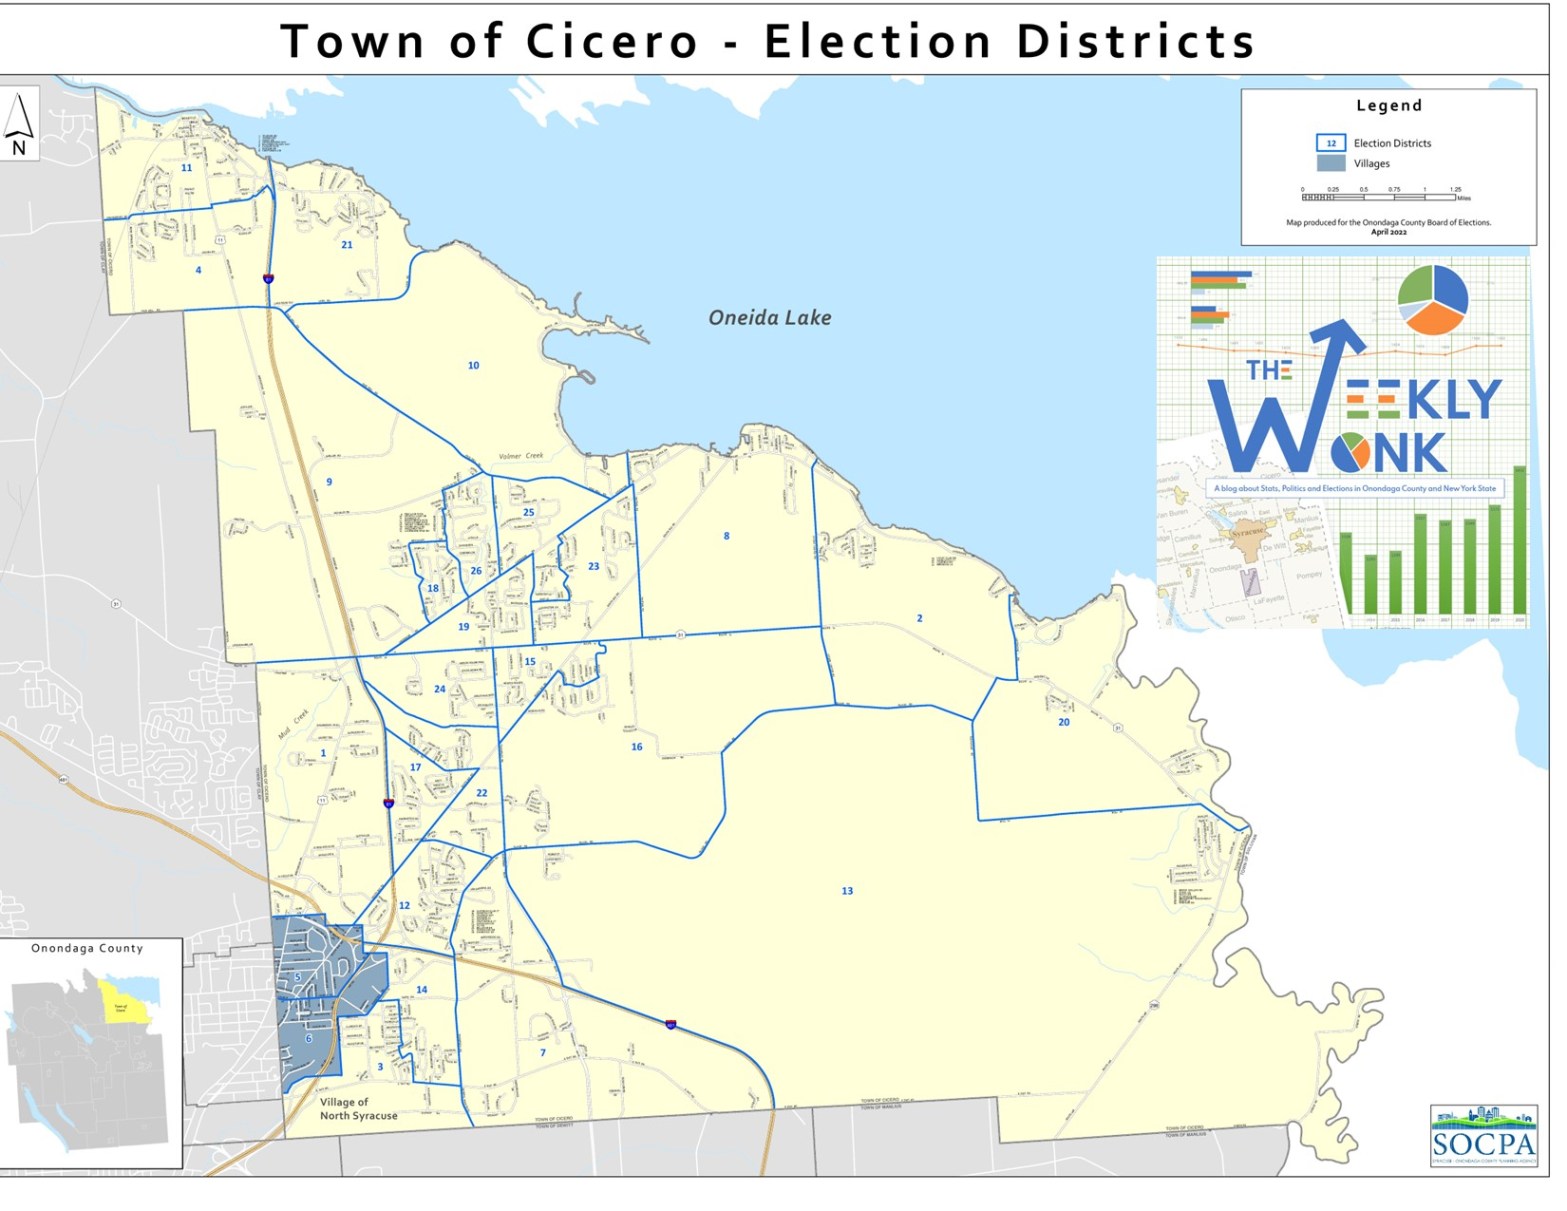
The Town of Cicero sits in the most Northeastern portion of our County. It is a large sized suburban town with 22,449 voters, the third highest town in Onondaga County. It is considered a suburban town but doesn’t share a border with Syracuse nestled between Clay, Manlius and Salina. The Town of Cicero is considered a solid GOP town, the largest political subdivision in Onondaga County with a significant GOP enrollment advantage. The makeup of Cicero is 30% Democrat (6745 Voters), 34% GOP (7547 Voters), and 29% non-Enrolled (6444 voters). This year I am breaking down the Towns into as equal as possible regions. Northern Cicero (eds 4,9,10,11, & 21) has 4660 voters (21%). Central Cicero (Eds 18, 19, 23, 25, 26) has 4354 voters (19%). Eastern Cicero (eds 2, 7, 8, 13, 16, & 20) has 5328 voters (24%). Southern Cicero (Eds 3, 5, 6, 12, & 14) has 4003 voters (18%). Western Cicero (eds 1, 15, 17, 22, 24) has 4104 voters (18%).
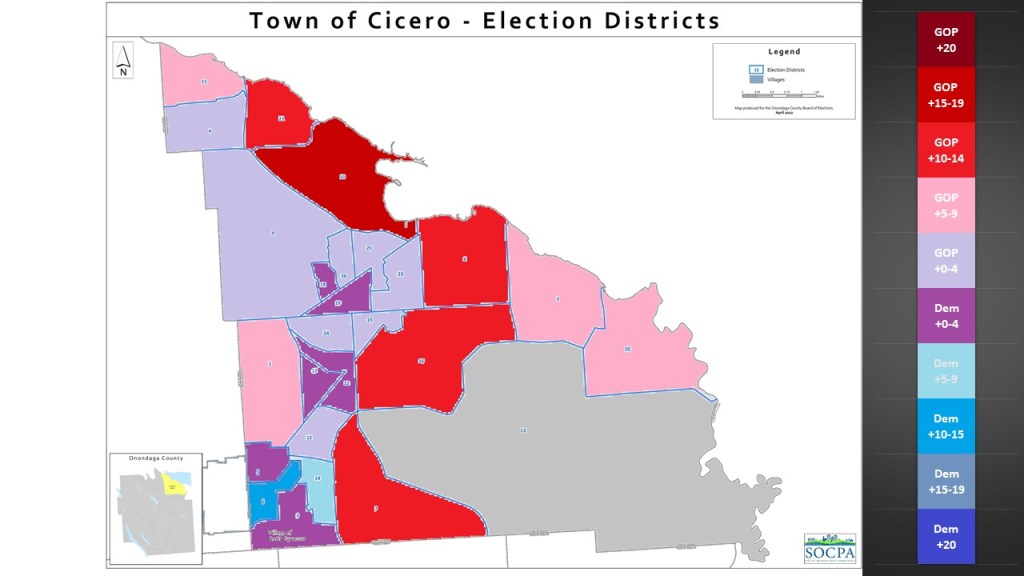
In a new feature I am bringing to the #weeklywonk this year I am doing a heat map for each political subdivision. I will be looking at the current partisan makeup of each individual ED and heat mapping its partisan lean based on the advantage for the Democrats and GOP. We see a wide variety of partisan leans in these eds. Ed 10 is the most GOP ed with an overwhelming GOP lean (-17.34%). EDS 7,8,16, & 21 have strong GOP (-10-15%). Eds 1, 2, 11, & 20 have a moderate GOP (- 5-10%). Eds 4, 9, 12, 15, 23, 24, 25, & 26 have slight GOP leans (-0-5%). Eds 3, 5, 17, 18, 19, & 22, have slight Democratic advantages between 0-5%. Ed 14 has a moderate Democratic advantage (+5.18%) and ED 6 has a strong Democratic advantage (+13.73%). Cicero’s largest geographic ed 13 has an even number of Democrats and GOP (354). In general, Democrats seem to be clustered into the southwestern corner near and around the village of North Syracuse where The GOP have the advantage in the eds bordering Oswego County and Oneida lake.
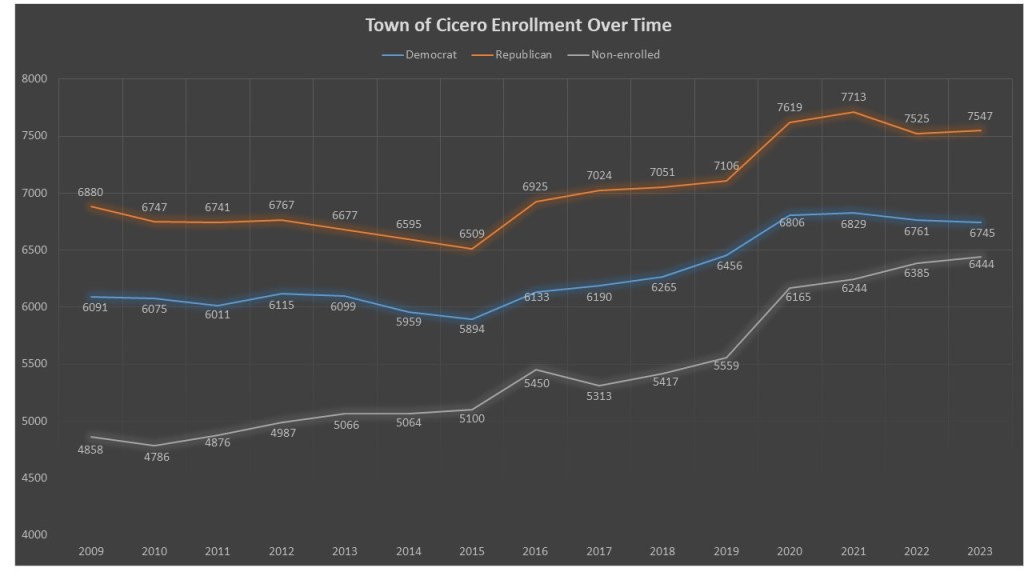
Since 2009 The Town of Cicero, unlike other communities in In Onondaga County, has not seen a change in partisan leanings. It has remained a stalwart Republican town. The Democrats have gained 654 voters since 2009. The GOP grew by only a slightly larger amount 667 voters. The Non-enrolled has been see largest gains by far with 1586 more voters. Unlike other communities that saw massive Democratic gains in the Trump years of 2016-2020 the Town of Cicero saw equal gains on both parties during those years. It seems that voters in Cicero reaction to the Trump years from both parties were to shed their party enrollment instead.
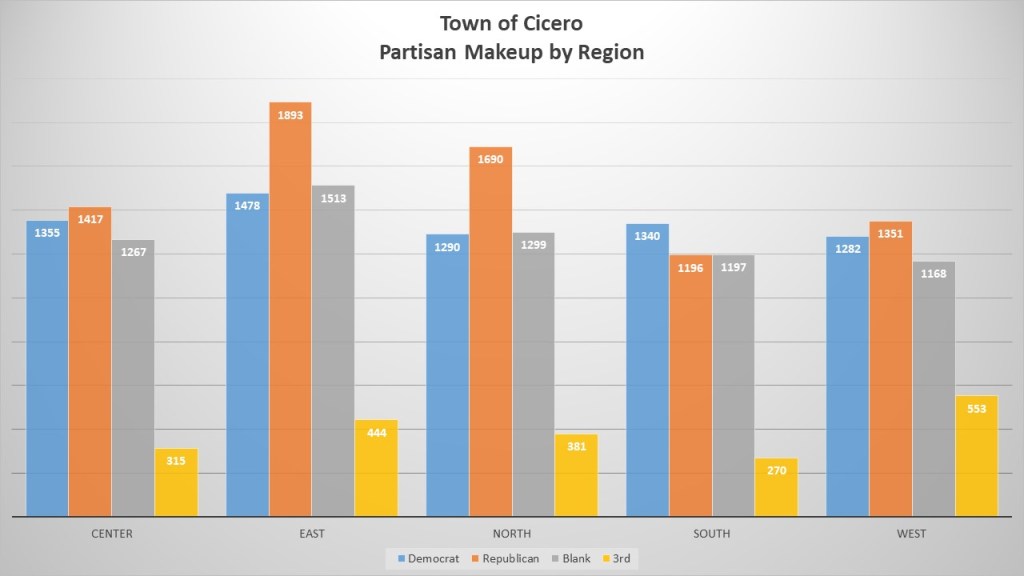
The regions in Cicero have a wide disparity. The Southern region including a portion of the village of North Syracuse is the most Democratic friendly. The Western region of Cicero that shares a border with Clay shows a small GOP advantage. The densely packed Center region with some of the more developed housing units also has a slight GOP lean. The GOP gains its advantage in domination of the Northern Bridgeport area and the Eastern portion of Cicero that is less densely packed. There they dominate and can dominate the entire town.
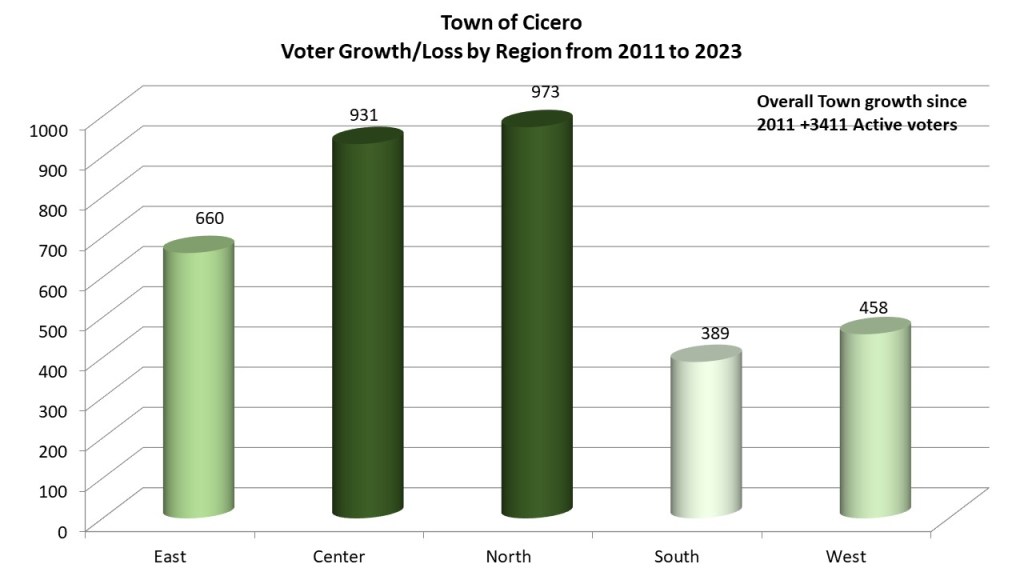
Looking at the growth of voters since the last redistricting cycle we compare it with date from right before redistricting of 2012. The Town of Cicero grew by 3411 active voters since 2011. The northern Bridgeport region saw the most growth with a gain of 973 voters. In close second, we saw the Center region with a nearly equal gain of 931 voters. The Eastern portion of Cicero had moderate growth of 660 voters. The western district (+458) and southern region (+389) voters saw the least gain. With Micron coming to neighboring Clay all these regions are likely choices for the influx of voters and it will be interesting to see the growths come next redistricting cycle.
The Town of Cicero is one of the more stable towns in Onondaga County in terms of partisan advantage. Since 2011 the GOP has only grown its advantage in Cicero by .02%. The Northern region has had the most change with a 2,24% shift towards the Democrats as its voter enrollment grew, but that is a relatively small shift. The Eastern region has seen the most GOP shift with 1.47% towards the GOP, again a very small shift. The Center region (+.31%) and southern regions (+.61%) saw incredibly small shifts towards the Democrats. The western region also saw a small sift (-.47%) toward the GOP. This all underlines the stability of the Cicero community in terms of partisan leans, but the wildcard here is the growing non-enrolled community that isn’t reflected in these partisan difference stats.
When we look at the comparative races, we see a solidly GOP town that votes significantly to the right of Onondaga County as a whole. In 2022 the Town of Cicero only voted for Governor Hochul’s by 41.96%, 11.82% worse than her win in Onondaga County rate of 53.78%. In 2021 the Town of Camillus only voted for Anthony Brindisis for Supreme Court by 39.45%, 13.05% worse than the county result rate of 52.50%. In 2020 Cicero was one of the few communities that didn’t vote for President Biden only giving him 46.59%, 12.29% points behind his Onondaga County win of 58.88%. In 2019 Cicero voted for Democrat Mark Kolinski for County clerk by only 37.50% losing 10.23% of his Onondaga County rate of 47.73%. The last head-to-head town office where Democrats contested was Supervisor in 2021 where Democrats lost by almost 25%. Even though non-enrolled voters have grown, the voting patterns above indicate they are more conservative than non-enrolled voters in other communities.
In 2023 the Cicero Town Democrats will caucus to find candidates for Supervisor, 2 Town Board members, and Highway superintendent. The Town of Cicero has already caucused but they are looking to fill some vacancies for most positions by July 31, 2023. If you are interested in running for any of these offices or want to help the Cicero Democrats contact their chairperson Rob Santucci at Rsantucc@twcny.rr.com
That is, it for this week’s edition of the #WeeklyWonk. Next week I will dive into the Town of Clay, the largest town in Onondaga County. As always go to dustinczarny.com and subscribe to get all your content and election news updates. I run that website, along with these series of articles, as part of my voter education. I never take ad money or charge subscriptions paying for the site with my own personal funds. Subscribe here.
This week I spoke with Bill Kinne who is running for County Executive. Bill is running on a more transparent and open government platform that will be more responsive to public input. Enjoy.
Today I talk about the end of the designating petition primary period which leads us to a discussion of primaries in Onondaga County. I also preview the objection process, the stalled NYS budget, and a surprising ruling out of Erie County on write in primaries. Enjoy.
Subscribe to dustinczarny.com for all election news and content updates
Welcome back to #WeeklyWonk. Each weekend I publish an article on a subject relating to elections in Onondaga County and New York State. Often these articles will have detailed stats to consume but sometimes they will be a recap of a prominent issue or on relevant election law. I am turning my eye to the 2023 elections. Today I look at the Town of Camillus, a town that is on the edge of becoming competitive for Democrats.
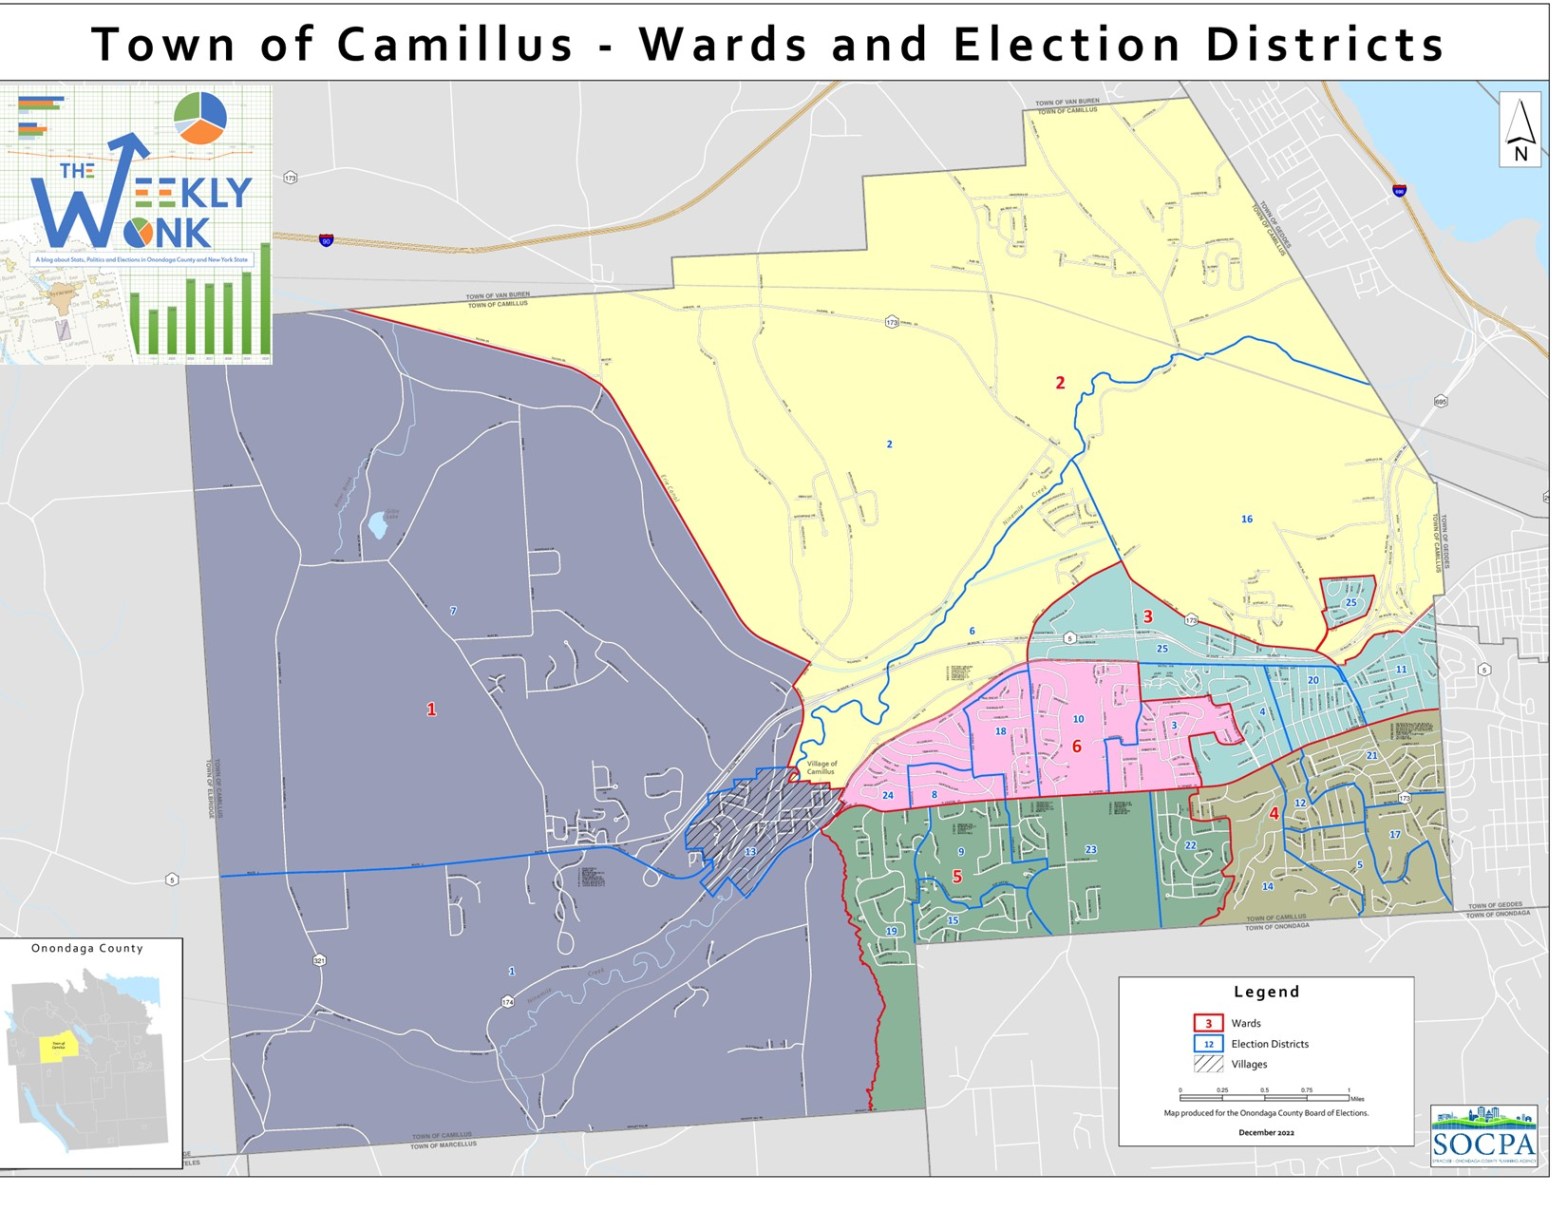
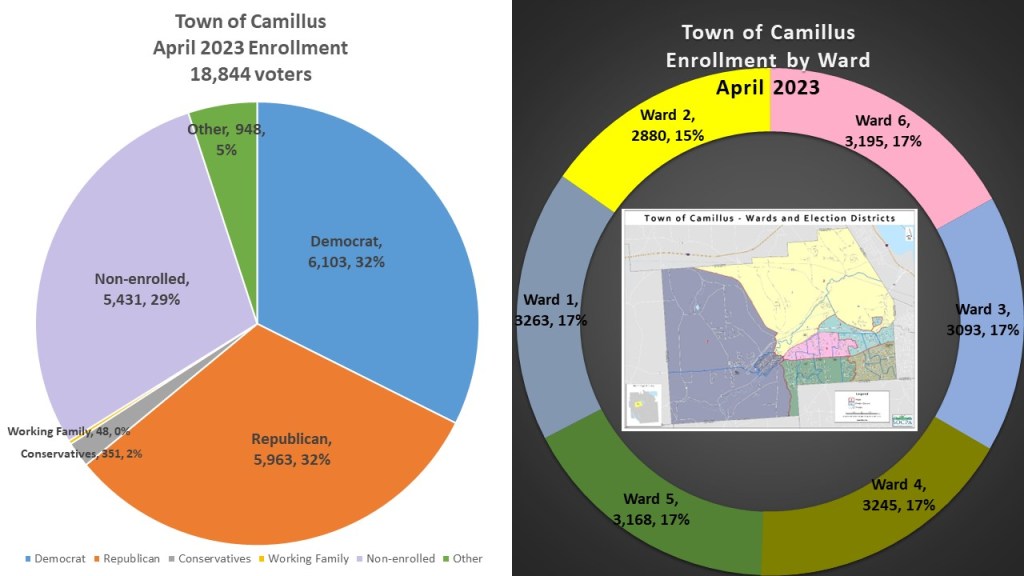
The Town of Camillus is in the western suburbs. Though it is a medium sized suburban town with 18,844 voters. Tt doesn’t share a border with Syracuse nestled between Elbridge, Van Buren, and Geddes. The Town of Camillus is considered a purple town with Democrats recently gaining the smallest of a plurality. The makeup of Camillus is 32% Democrat (6103 Voters), 32% GOP (5963 Voters), and 29% non-Enrolled (5431 voters). One of the few towns that have a near equal share of the three major political identities. The Town of Camillus is the second of two towns that are broken up into wards, meaning they elect their town boards in predetermined areas rather than town wide. There are six town wards in Camillus. Ward 1 has 3263 voters (17%), Ward 2 2880 voters (15%), Ward 3 3093 voters (17%), ward 4 3245 voters (17%), ward 5 3168 voters (17%), and ward 6 3195 (17%). These wards are fairly equal because the Town Board of Camillus underwent a redistricting process last year that fixed some of the overpopulation. The wards are similar to the old ones and make sense in terms of geography and shape. Though to get equal portions they did create a small balloon appendage in ward 3.
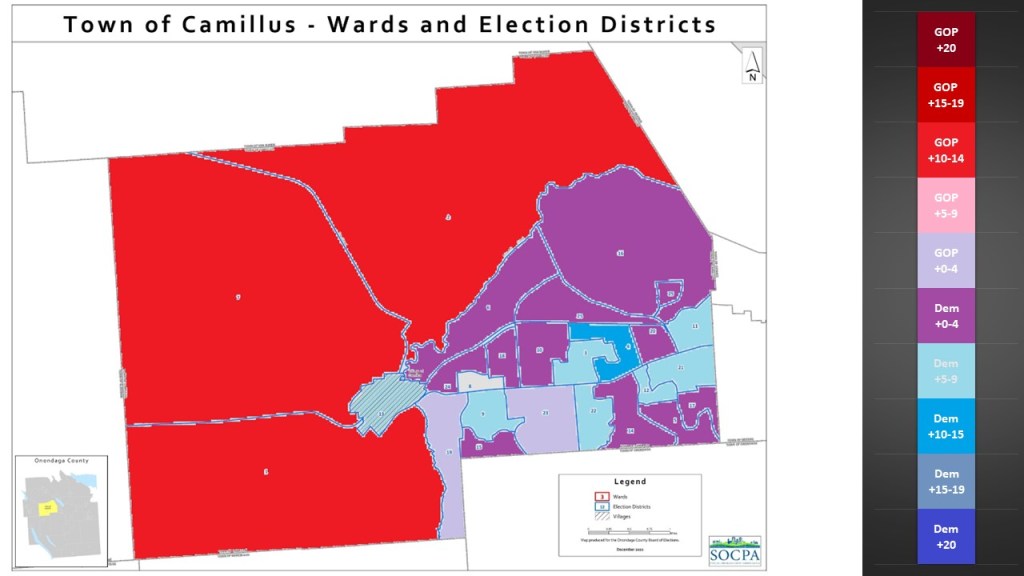
In a new feature I am bringing to the #weeklywonk this year I am doing a heat map for each political subdivision. I will be looking at the current partisan makeup of each individual ED and heat mapping its partisan lean based on the advantage for the Democrats and GOP. We see a wide variety of partisan leans in these eds. Eds 1,2,7 have a strong GOP advantage between 10-14%. Eds 19 & 23 have alight GOP advantage between 0-5%%. Eds 5, 6, 10, 14, 16, 17, 18, 20, 24, 25 have Democratic enrollment advantages of less than 5% making them borderline eds much like the town itself. Eds 3,9, 11, 12, 13, 21 & 22, have slight Democratic advantages between 5 & 10%. Only 1 ed, ED 4 has a solid Democratic advantage between 10-15%. And in a first in this year’s look at individual eds, we come across an ed with equal numbers of Democrats and Republicans, ed 8. In general, the western and northern parts of Camillus are more GOP and as you progress into the southeastern corner along with the village of Camillus in the center, we see a more Democratic shift.
Since 2009 The Town of Camillus has seen a radical shift in partisan makeup. Once a stalwart Republican town, shifting demographics as population shifts saw a growing Democratic population that was supercharged in 2016 gaining 1028 voters. The GOP on the other hand saw a slow and steady decline losing 498 voters. The Non-enrolled has been see large gains as well, garnering 998 more voters. This follows a pattern of other suburban towns like Salina and Manlius. New voters in terms of age and transplants prefer the Democratic and Non-enrolled registration status as the older GOP population is losing voters and not replacing them.
The wards in Camillus are represented by the GOP, though the representative in Ward 5, Richard Griffo, has won cross endorsement when he has run. However, these wards reflect the changing nature of Camillus. Ward 1 and Ward 2, represent the western and northern parts of Camillus have solid GOP leans in their enrollment. Wards 3,4,5, & 6 all located in the more populous southeastern corners have Democratic pluralities, with Ward 3, the most eastern district, looks the most promising for Democrats with the non-enrolled threatening to overtake the GOP.
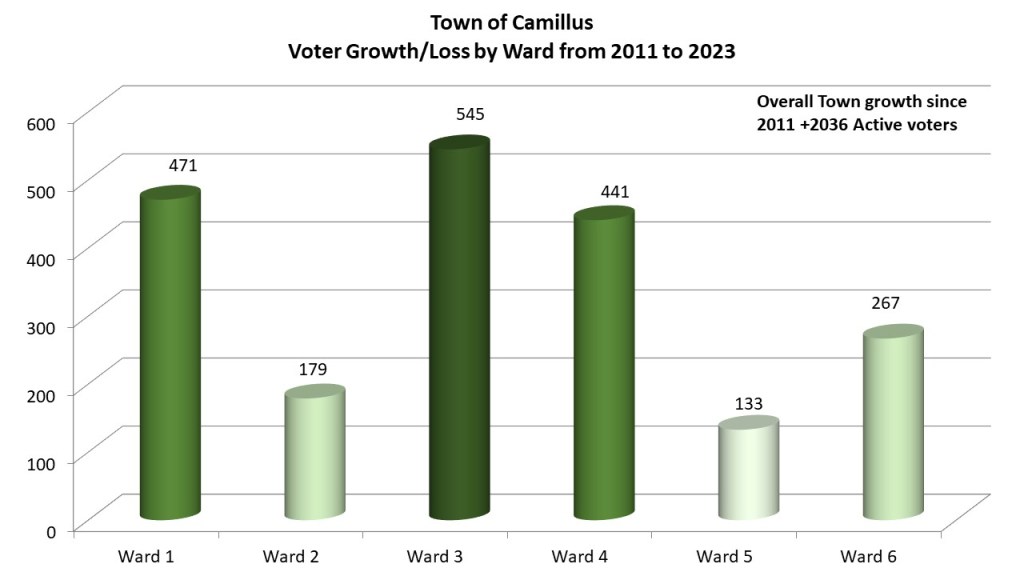
Looking at the growth of voters since the last redistricting cycle we compare it with date from October 2011, before the redistricting of 2012. The Town of Camillus grew by 2036 active voters since 2011. Wards 3 the most Democratic and smallest geographic ward, is the biggest gainer with 545 more voters. Ward 1, the largest geographic ward most GOP ward grew quite a bit, with 471 new voters. Ward 4 also grew quite a bit with 441 voters. Ward 2 (+ 179), 5 (+133), 6 (+279) all had moderate growth. The fluctuations in growth are most likely due to the redistricting earlier this year, mainly to address the overpopulation in Ward 2 and underpopulation in ward 4.
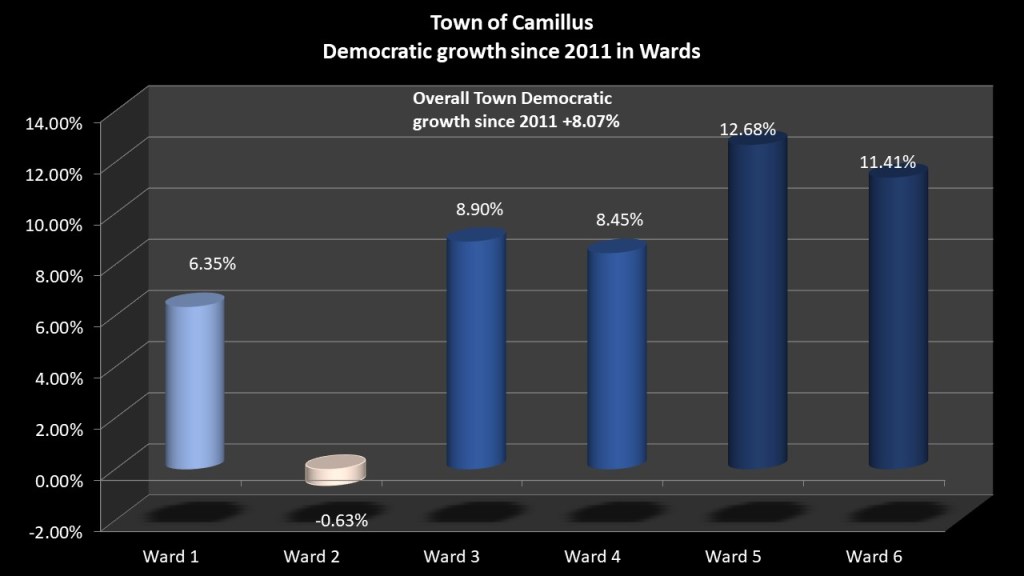
The Town of Camillus Democratic advantage has grown by 8.07% since 2011, which is typical growth we have seen in Onondaga County. Ward 1, the most GOP district has seen growth in the partisan difference for Democrats as they narrowed the gap by 6.35%. Ward 2 actually saw GOP growth of .63%, which is mainly due to a Democratic voting block being moved into another ward during redistricting. The Southeast wards saw the most Democratic growth. Wards 3 (+8.90%) and Ward 4 (+8.45%) saw strong Democratic growth. Wards 5 (+12.68%) and Ward 6 (11.41%) saw even stronger Democratic growth. In fact, Wards 3,4,5,6 were all GOP dominated wards in 2011 and now have flipped to have a Democratic plurality.
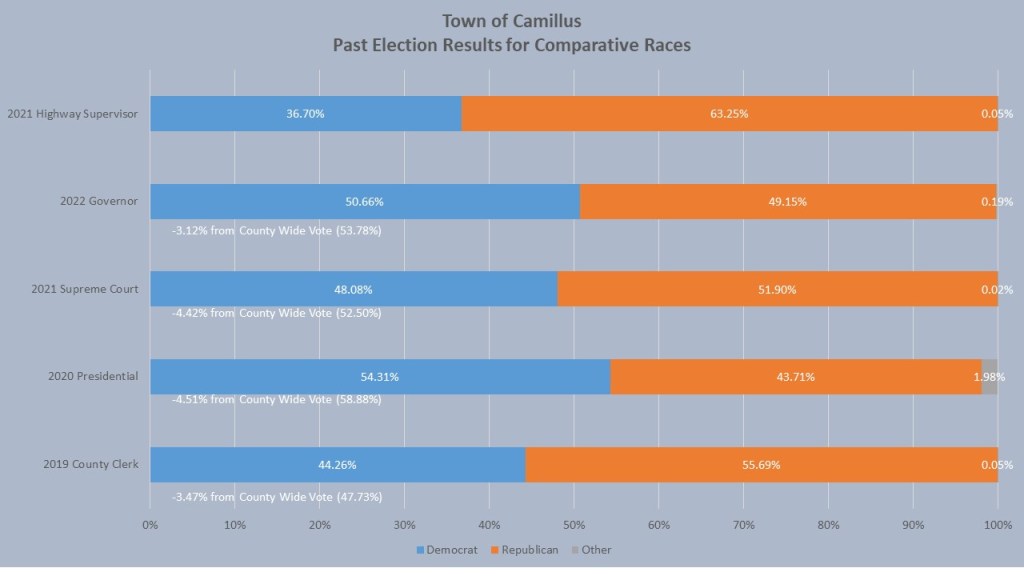
When we look at the comparative races, we see the duality of a purple town in Onondaga County. In even years Camillus votes solidly for Democrats at the top of the ticket, and in odd years it votes republican. In 2022 the Town of Camillus voted for Governor Hochul’s by 50.66%, 3.12% worse than her win in Onondaga County rate of 53.78%. In 2021 the Town of Camillus voted for Anthony Brindisis for Supreme Court by 48.08%, Brindisi was off by 4.42% worse than the county result rate of 52.50%. In 2020 Camillus voted for President Biden 54.31%, 4.51% points behind his Onondaga County win of 58.88%. In 2019 Camillus voted for Democrat Mark Kolinski for County clerk by 44.26% losing 3.47% of his Onondaga County rate of 47.73%. The last head-to-head town office where Democrats contested was Highway Superintendent, and it did not go well for Democrats, losing by over 26%. We see that Camillus is running about 3-4 points behind Onondaga County as a whole because it is near even registration where Onondaga County is more blue leaning registration wise.
In 2023 the Camillus Town Democrats will caucus to find candidates for all 6 ward councils as well as Supervisor, Town Justice, and Highway superintendent. The Town of Camillus Democrats fill their candidates by caucus. The Caucus has not yet been scheduled but can be anytime between now and July 27, 2023. If you are interested in running for any of these offices or want to help the Camillus Democrats contact their chairperson Den Petrick at daniel.e.petrick@gmail.com.
That is, it for this week’s edition of the #WeeklyWonk. Next week I will dive into the Town of Cicero, the largest GOP town in Onondaga County. As always go to dustinczarny.com and subscribe to get all your content and election news updates. I run that website, along with these series of articles, as part of my voter education. I never take ad money or charge subscriptions paying for the site with my own personal funds. Subscribe here.
I am pleased today to announce that I have joined the Faces of Democracy with Issue One. This bi-partisan group is made up of some of the more notable Election Administrators and advocates in the country. It is a bi-partisan group that is working together on the following issues:
–Election officials and poll workers should not face political pressure, threats, or intimidation for doing their jobs and protecting the integrity of our elections
–Elections are essential infrastructure for our democracy and Congress should provide states and localities with regular, predictable, and sufficient funding
I am happy to be a part of this project. For the past six years I have worked to advance these very goals in New York State and now I get a chance to work with like minded administrators from across the country to advance these goals on a national level. In June I will be travelling to DC as part of Issue Ones second annual DC trip to meet with officials on Capitol Hill, the White House, federal agencies (Department of Justice and Homeland Security) and more.
You can see the amazing group of election officials I am joining here, and yes my profile is there as well.