Welcome back to #wonkywednesday. Every week I take a write a column dedicated to election and registration data in Onondaga County and New York State. Absentee and mail in balloting has become needlessly controversial over the last two elections due to the rhetoric of the former President and his supporters. Furthermore in New York our arcane rules have put an unusual spotlight on mail in ballots as they were sequestered and not counted until 2 weeks after Election Day. Those rules will change for 2022. In a blow to mail-in ballot supporters the proposition for no-excuse balloting failed at the 2021 general election. Whether this dampers the growth we have seen in mail-in balloting in the future of New York will be interesting to watch in 2022 and beyond. This week I investigate the absentee, affidavit, and court order ballot data from the 2021 general election.
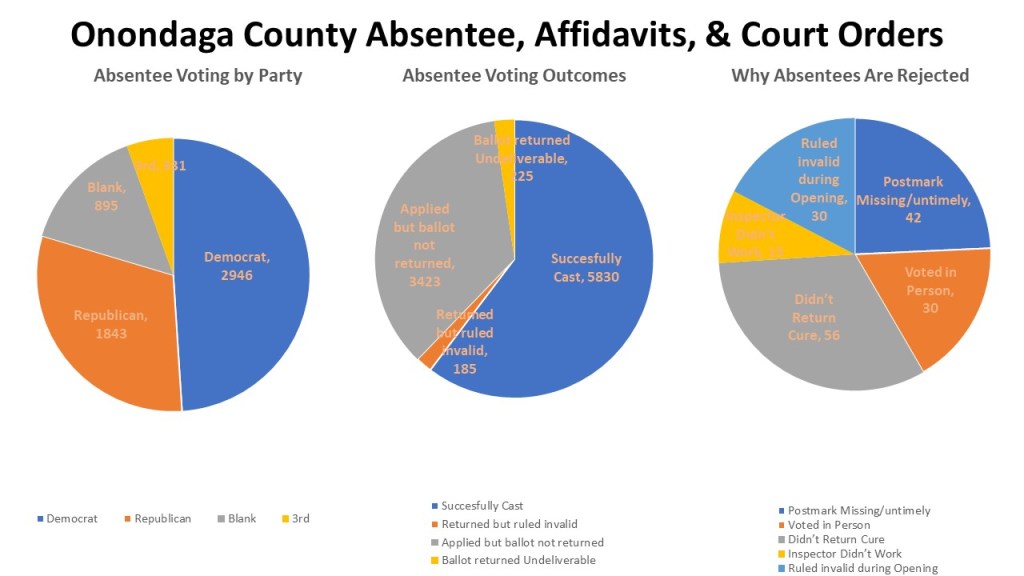
Democrats continue to dominate Absentee voting in 2021 as they did in 2020. The 2946 ballots cast by Democrats accounted for nearly 49% of all ballots while the GOP (1843) accounted for 30.6%. Like with Early Voting Democrats outpaced their enrollment in Onondaga (38.4%) as did the GOP (27.3%). The story of the 2021 election continues to be non-enrolled voters participating at lower rates. Their 895 ballots were just 14.9% of the absentee ballot total despite being 27.3% of the overall electorate. There were 9438 absentee ballots requested overall with 3423 (36.29%) not returning their ballot. Another 225 the ballots were returned as undeliverable (2.4%) most likely permanent absentees who moved since last election.
Another 185 were returned but ruled invalid. Of the invalids 56 (30.3%) were ruled that way because they did not properly fill out the ballot envelope and did not return the cure affidavit sent by the BOE in time. Another 42 (22.7%) returned their absentees postmarked after Election Day. 30 (16.2%) voted in person during Early Voting or Election Day while another thirty were ruled invalid during the absentee opening after inspecting the ballots inside. Finally, 15 (8.1%) ballots were pulled as they were issued to Election Inspectors who then decided not to work on Election Day, rendering their excuse invalid.
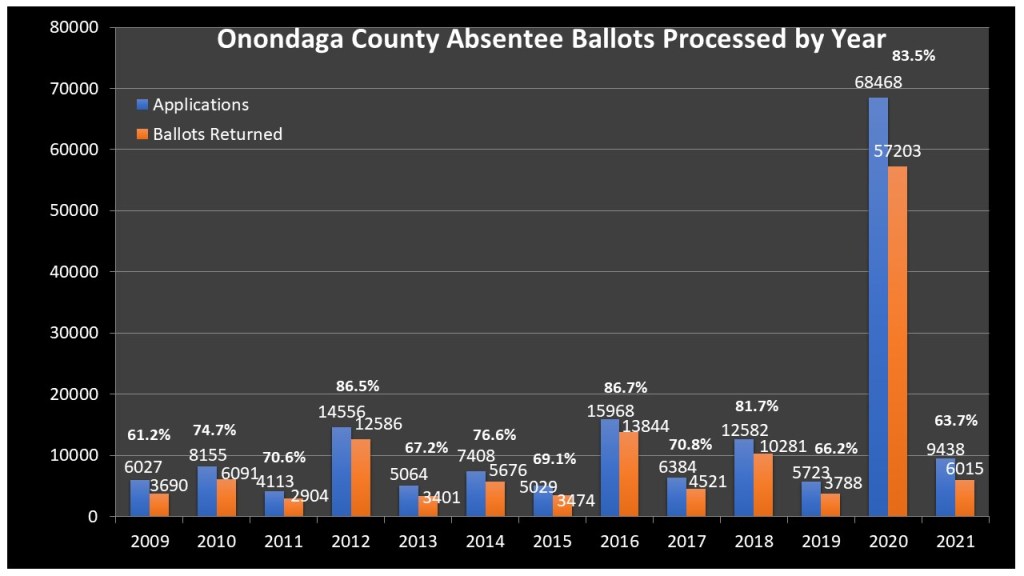
Like Early voting, absentee ballots rise and fall in ratio to overall turnout. They also seem to correlate to federal versus local election years with voters not only increasing in numbers requested but return rate in federal years. In 2021 more voters requested and returned absentee ballots than all but a few years since 2009. 2012, 2016, and 2020 were presidential years and accounted for the high requests, 2018 a mid term year that came closer to presidential turnout than others. In 2010 there were less requests but slightly more returned ballots. Despite a low turnout for 2021, a higher number of voters are turning toward alternative voting methods from Election Day. The downside for absentees is that despite the high number of requests there was a high number of ballots unreturned as compared to previous years. The 63.7% return rate was the lowest return rate since 2009 (61.2%).
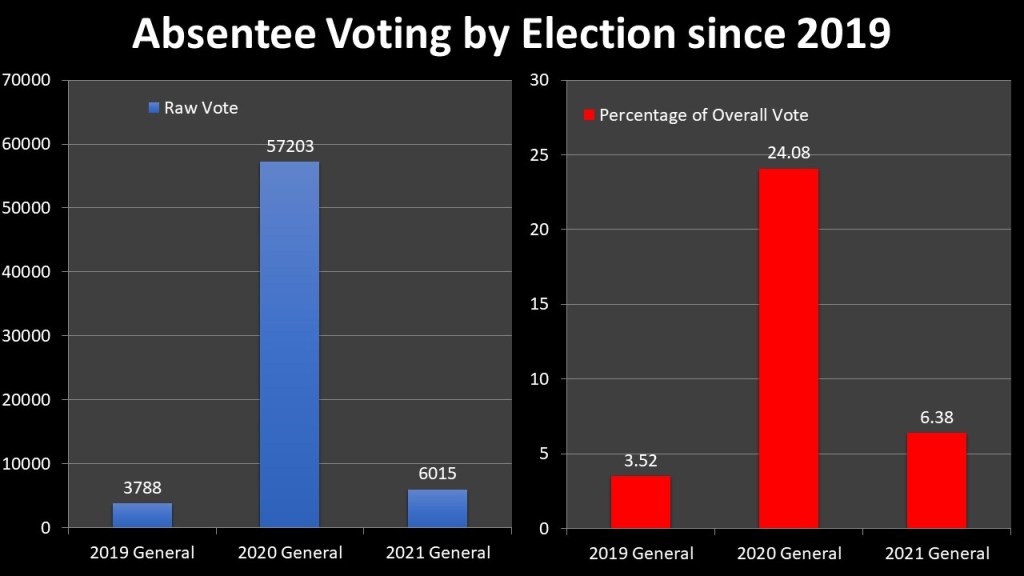
Ever since the reforms initiated in 2019 that brought about Early Voting the electorate has been adapting to the new options for voting. As we can see in 2019 the call for absentee ballots was low with just 3788 voters choosing this method or just 3.52% of the overall vote. Voters were turning to Early Voting for their alternative method. As COVID 19 raised its head in 2020 voters sought to stay at home and vote in record numbers with 57203 voters and a daunting 24.08% of the overall vote. In 2021 with COVID still lingering and voters used to alternative methods we did see a marked increase in ballots returned of 6015 and overall electorate percentage of 6.38%.
Two other alternative forms of voting remain to be examined, affidavit and court orders. In 2019 a little-known reform has made affidavit voting a more potent method of voting, the universal transfer of registration. This allows more affidavits to be counted than before since it expanded the acceptable eligibility of registered voters from the county where the vote was cast to all of New York State. This eliminated one of the more common reasons a voter affidavit was reject. In 2021 547 voters cast ballots as affidavits. Only forty-four were ruled invalid. This along with the use of electronic poll books to re route voters to the right polling place has resulted in a 92% acceptance rate, the highest since 2009 and maybe ever. Most of the remaining rejected affidavits are those who refuse to show up at the right polling place or were not registered to vote in the first place.
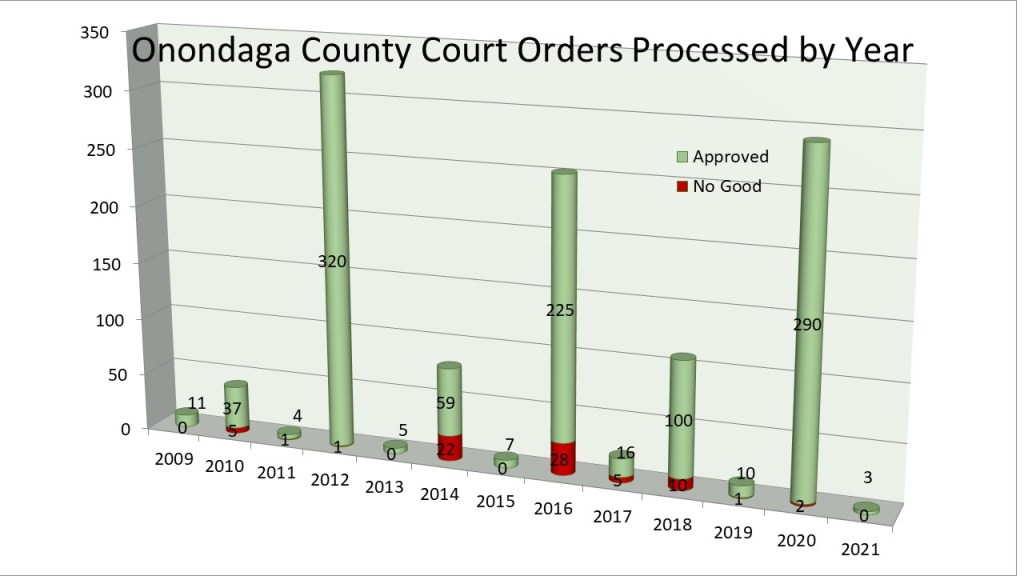
Court orders are the last alternative voting method, but it is the least used of all. Court orders now are only used by those moving from out of state after the voter registration deadline or those who have failed to register for one reason or another. In 2021 we saw only three court orders throughout the entire Early and Election Day voting period. This is the lowest court order request on record since 2009.
That is it for this year’s #wonky Wednesdays. Next week I will continue the examination of the 2021 election with a look at the Election Day vote and then a final look back at the 2021 election with how Democrats and Republicans did in Onondaga County in overall contests. This will be my final update on Tumblr for my #wonkywednesday articles. I have a new project in the works that I will be announcing on Sunday January 2nd that will change how I communicate with voters throughout all my various platforms. Stay tuned and have a Happy New Year.
In today’s Commissioner in a Car I talk about the upcoming hearing for redistricting in Onondaga County Wednesday at 11:30am. I also do an informal recap of 2021 and some of the challenges Onondaga County Board of elections faced throughout the year.
Merry Christmas. In today’s Zoom with Czarny I am honored to speak with Brianna Lennon. She is a CNY native, County Clerk for Boone County Missouri, and the host of the national elections podcast High Turnout Wide Margins, We talk about the difference in NY and MO elections as well as why she started this election focused podcast. Enjoy.
“We’ve had six each of the last three years. As you know, I’ve advocated for more. Now, the bare minimum will be 10 sites, which many of us have been advocating for in Onondaga County.”
Welcome back to #wonkywednesday. Each week I take a deep dive into the election and registration data around Onondaga County to give a better sense of our diverse home. This week I continue to look back at the 2021 General Election. Today I focus on Early Voting and how Onondaga County voters used this reform.
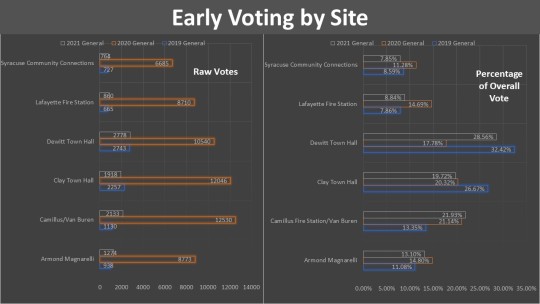
Democrats continue to use the Early Voting reform more than any other party. Democrats make up just over 38.4% of the overall electorate of Onondaga County. In 2021 Democrats made up 39.5% of the turnout for the General Election. Therefore, it is significant that Democrats make up just under 52% of the Early Vote. This disparity can be directly traced back to both the rhetoric against Early Voting by the GOP and investment in Early Voting GOTV by the Democratic party. Of the 6 Early Voting sites Dewitt Town Hall dominated the Early Voting Turnout with 2728 voters voting there. Camillus Town Hall (2133) and Clay Town Hall (1918) followed at 2 & 3. Armond Magnarelli (1274) was fourth, Lafayette Fire Station (860) was fifth, and Syracuse Community Connections (764) was sixth.
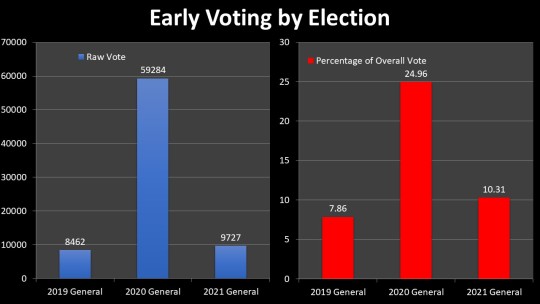
2021 was an abnormally low turnout year. It was the lowest turnout in the General Election since 2015. Early Voting turnout was certainly lower than the tremendous turnout in 2020. In 2020 record turnout was reflected in overall raw Early Votes (59,284) and percentage of overall vote (24.96%). Though 2021 paled in comparison to 2020, it increased numbers and percentages from the last local year, 2019, despite lower turnout. 2021 Early Vote of 9727 was a 15% increase from 2019. The overall percentage of the electorate increased from 7.86% in 2019 to 10.31% in 2021 as well.
Local years have shown to have dramatically different turnouts to federal years in certain communities. The City of Syracuse had particularly low turnout in 2021 however Armond Magnarelli and Syracuse Community Connections saw higher voter totals (1274 & 768) in raw numbers than 2019 (938 & 727), however Syracuse Community Connections was a lower vote share (7.85%) than 2019 (8.59%) and Armond increased its vote share (13.10%) from 2019 (11.08%). Lafayette Fire Station & Camillus Fire Station saw an increase in their raw vote totals (890 & 2,133) from 2019 (665 & 1,130) and their share of the Early Vote (8.84% & 21.93%) from 2019 (7.86% & 13.35%). The big jump in Camillus may be attributed to the change of location as the western site was in Van Buren Town Hall in 2019. Dewitt Town Hall saw an increase in the raw vote totals (2,778) from 2019 (2,743). However, their overall voter share. .56%) dropped from 2019 (32.42%). Finally, Clay Town Hall dropped in both raw numbers (1918) from 2019 (2,257) as wall as vote share (19.72%) from 2019 (26.67%). What we are seeing is more spread-out usage of the three main suburban sites from 2019 while the city sites and rural sites still lag in participation.
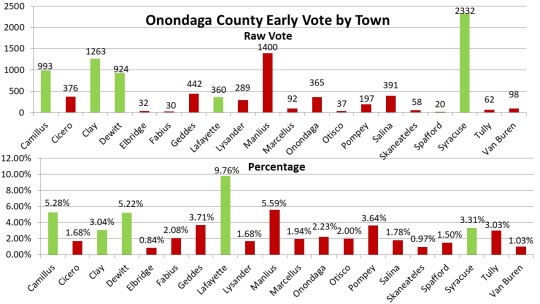
The location of Early Voting sites drives the participation from individual Towns and the City of Syracuse. In the above chart the green bars represent the five towns where Early Voting sites reside in: Syracuse, Camillus, Clay, Dewitt & Lafayette. In terms raw turnout numbers, the City of Syracuse dominates the participation (2332) but also has two sites and more population than any individual town. Camillus (993) Clay (1263) and Dewitt (924) are also large participants as they are high population towns. In terms of percentage of the electorate Lafayette leads in overall percentages (9.76%) despite a low actual number (360). On the converse Syracuse overall percentage of usage (3.31%) is exceptionally low as is Clay (3.04%). Camillus (5.28%) and Dewitt (5.22%) remain high on percentage
As we look toward Early Voting Expansion in 2022 as we will have to look at the towns who do not participate as much, The Town of Manlius is one of the standouts for towns without an Early Voting site in It Though it must be noted the Dewitt Town Hall is on the border, still Manlius is second in over vote total (1400) and percentage (5.59%) despite not having an EV center in it. Conversely the towns of Lysander (1.68%), Cicero (1.68%), Onondaga (2.23%) and Salina (1.78%) are particularly large towns that do not participate as well as Camillus, Clay, and Dewitt in Early Voting. Finally, the drop off in the City of Syracuse could be addressed with Early Voting sites inside them.
That is all for this week. Next week I will look at absentee voting in the 2021 General Election.
Today I talk about the passage of the GOP maps for Onondaga County legislature and prepare us for the road ahead. We are also waiting on 4 bill from Governor Hochul which have to be signed tomorrow. Enjoy.
Today I speak with Susan Lerner of Common Cause New York. We talk about what her organization and Let NY Vote will be looking for in election reform in the upcoming session. She also weighs in on the redistricting with Onondaga County and the City of Syracuse as she has been a major proponent of redistricting reform nationally as well as locally. Enjoy.
Welcome back to #wonkywednesday. Each week I do a deep dive into the election and registration data that makes up the electoral landscape of our home, Onondaga County. I am taking a bit of a diversion this week to delve into the topic dominating our political discussion here, redistricting of the County Legislative districts. Over the last two months there has been a wild and rushed process where the GOP legislators and County Executive have rushed through a process that resulted in the County Executive vetoing their own maps. This has put the county in a bit of chaos as the County Charter has no prescribed way forward. The County GOP legislators now have started another process to decide these maps by December 21, 2021 with legislators drawing their own maps. The Democratic caucus has put forward a plan to take longer and sending the maps back to the reapportionment commission.
The County GOP though seems determined to have a vote on December 21, 2021 and the Democrats and GOP have put forward new maps. To make things more complicated the GOP has submitted two different maps (2.5 &4.0) while the Democratic legislators have submitted their maps (3.0). The GOP maps only differ in how they divide the City of Syracuse and their suburban divisions are the same. You can view the maps here at the Reapportion Commission website: http://www.ongov.net/legislature/ReapportionmentCommission.html.
For today’s #Wonkywednesday I will dive into the differences between the GOP and Democratic maps both visually and with some statistics as well. While at first blush the maps completely different, their differences boil down to 4 main areas of the County. I will look at first how the divide up the City of Syracuse, the Northern Suburbs, Eastern Suburbs, and Western Suburbs, where the differences are most stark. The choices in these four areas of the county show the different philosophies in redistricting for the GOP and Democratic lawmakers.
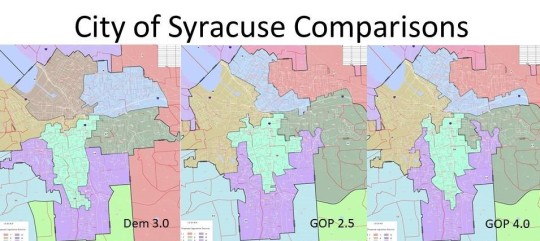
The choices inside the City of Syracuse are where all the differences start. Choices made here have ripple effects throughout the county as a whole. It is also the place where the most improvement could come from the disastrous 2011 map which divided the City of Syracuse into 9 different legislative districts with only 2 totally inside the City and 7 stretching city portions out into the county. This idea of “metro-government” was a novel concept proposed by Onondaga County Reapportionment Committee member Ryan McMahon, now the County Executive. Critics have claimed, including me, this was just another term for Gerrymandering and divided the City needlessly. With a population of over 148k the City of Syracuse could have 5 whole districts inside of it and sixth district would be needed to take some excess population. Both the GOP plan and the Democratic plan try to fix this by having just 6 districts in the city, but that is where the similarities end.
The Democratic plan divides the city into 5 wholly contained districts representing neighborhoods in the East, Northwest, North East, center city and valley portions of the City. A small portion of the west side is paired with Geddes and a small portion of Camillus to create another district. The two GOP have 6 districts but 3 of them span out into neighboring towns leaving only 3 districts inside the City proper. The 6 districts do not really fall into known neighborhoods chewing up traditional neighborhoods like Eastwood, Lincoln hill, university, and the south side into different districts. There are also stark differences in minority representation which I will dive into in the metrics portion of this column.
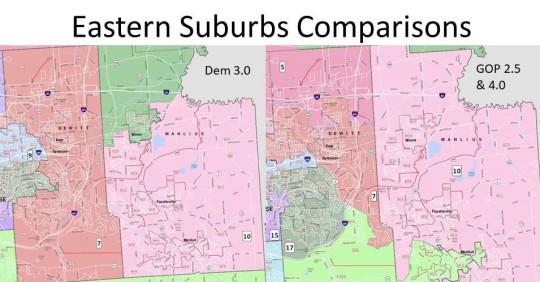
The Eastern suburbs are most affected by the desire to split the city into districts and pair them with more white areas of the county. The Town of Dewitt in particular is drawn and quartered in the GOP plan. Despite having a population of just 26k and could easily fit inside one legislative district, as we see in the Democratic plan, but they needlessly divide it into 4 different districts. In fact the Dewitt portions are either in the minority or near the minority in all four districts making it likely a Dewitt resident may not be represented in the legislature under the GOP plan. With Dewitt being a heavy Democratic town this move is suspect, especially when in the GOP plan the town of Lysander is kept whole, a similarly populated town with high growth rate but just happens to be Republican. They also move the traditional Town of Manlius district north and take the village of Manlius out of this district. The Village of Manlius happens to be Democratic and the newly elected GOP legislator Gregg Olson barely won his election in an ever blue town of Manlius. This could be why they are trying to make OCL 10 more conservative.
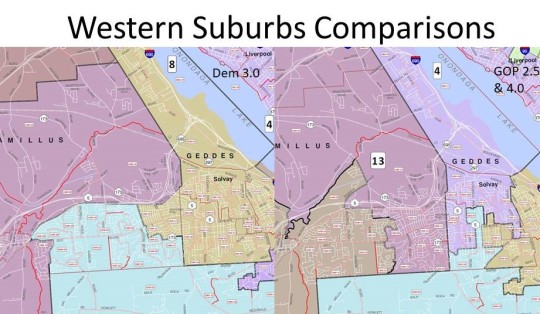
The Western suburbs are similarly affected by the City of Syracuse choices. In the Democratic plan the town of Geddes is kept whole inside one inside one legislative district that adds population from fast growing Camillus and the West side of Syracuse. The GOP plan splits the town into 3 different districts, despite it having only 17K citizens and actually having a negative growth rate over the last ten years. A similar town in Onondaga with 22k which lost population was kept whole in the GOP plan. The Democrats do divide Camillus into three districts where the GOP divides it into two, however the choices within are still suspect. Eastern Camillus is paired with Elbridge the western most towns in the GOP plan through a portion of Van Buren creating a long winding district. The Democrat plan divides eastern Camillus into two different districts pairing with neighboring towns while keeping the western portion of Camillus with Elbridge.
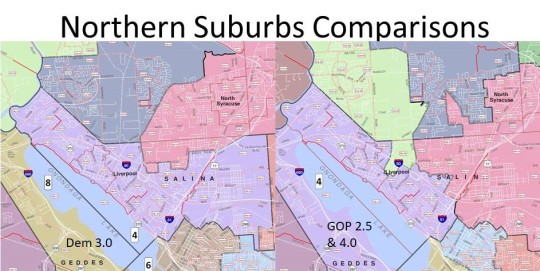
Finally the Northern Suburbs, particularly the Town of Salina is an interesting snapshot of how even when the Democratic and GOP maps agree on number of districts in a Town, their differences show the different choices they make. In the Democratic map the Town of Salina has three different districts, however 28k residents of the town of 33k is in one district, a small Election District bordering Dewitt is put into that district and a small portion of Salina is paired with the new district 5 that takes excess population from Cicero, Salina and Clay as they all require more than one district. In the GOP map a random Ed is paired with a Clay district, half the town is paired with the district 5, and the other half is paired with a winding district that snakes around Onondaga Lake into Geddes putting the residents of Solvay and Liverpool together.
Looking at the 3 new maps and comparing with the old maps all of them do a better job of trying to keep towns from being divided unnecessarily, but again the Democratic plan is best. Each legislative district must be approximately 28k residents. So any town with less than 28k residents the goal should be to put it wholly into legislative district. Manlius, Salina, & Cicero have more than28k residents so they would ideally have two legislative districts inside of them. Clay has 60k residents so it should have 3 districts, and as we discussed Syracuse with 148k residents would have 6. In the GOP map the Towns of Dewitt(4:1), Salina(3:2), Camillus(2:1), Geddes(3:1), Van Buren (2:1) & Onondaga (2:1) have more than the required legislative districts in them. In the Democratic Maps Camillus (3:1), Onondaga (2:1), Lysander (2:1), Van Buren (2:1) & Salina (3:1) have more than required. Van Buren in both maps is divided mainly to keep the village of Baldwinsville whole, which is required by the new state law. In Onondaga in both maps the Onondaga Indian nation is divided and put in the southern district where the Democratic map added in the Nedrow community as a whole. Lysander and Camillus have seen higher than average growth in population along with Clay and Manlius so if that pattern holds having division in those towns are justified. The towns of Geddes and Dewitt have been population neutral over the last ten years if not deficit and dividing them in the way the GOP has done is arbitrary and needless.
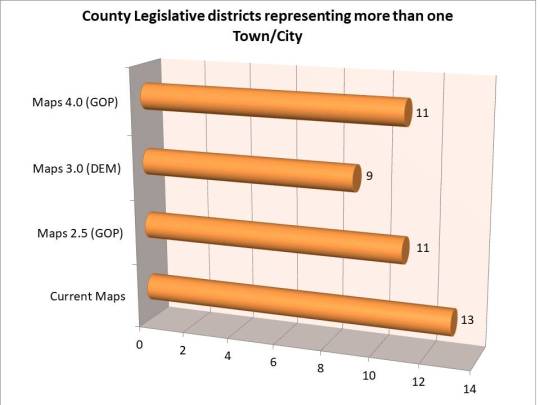
Similarly having a representative cover more than one Town or city should be avoided ideally to allow them to focus on that areas needs and advocate for those citizens. The Democrats by keeping neighborhoods together have done that with only 9 districts spanning Town/City lines while keeping 5 districts wholly inside the City of Syracuse, 2 inside the Town of Clay, and 1 inside the Town of Manlius and Salina. The GOP in their theory of Metro Government has 11 seats spanning lines while keeping 3 districts wholly inside the City of Syracuse, 1 district wholly inside the Towns of Clay, Cicero, and Manlius.
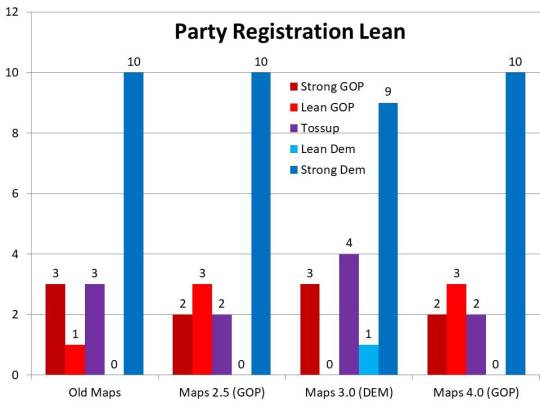
It is hard to determine partisan leans in these districts as turnout in odd year elections ends up playing more of a factor than actual registration. For instance Democrats have had strong partisan leans in 10 districts for the last several cycles yet only consistently win in 6 seats. This is in part due to lower Democratic turnout in odd years as we saw in last week’s #wonkywednesday as well as large swaths of non-affiliated voters who vote differently in local elections than they do in federal elections. Incumbency is also a factor as well. For purposes of illustration though I have ranked the districts in terms of strong and lean rankings for partisan purposes where if a party had more than a 5% enrollment advantage it would have a strong ranking, less than 5% but more than 3% it would have a lean ranking, and lower than 3% it would be a tossup. It’s clear in these rankings that both GOP maps create more leaning GOP districts than the current maps and less tossups. The Dem map creates more tossups, lessens the advantage in one Democratic district and has one less GOP leaning district.
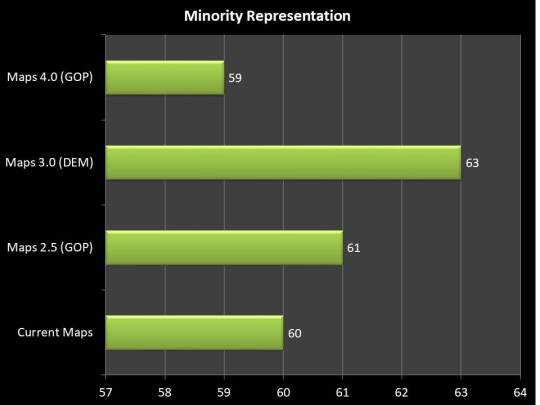
I thought it would be helpful to get a neutral unbiased look at these various proposals. A third party has uploaded the 3 new map proposals as well as the old proposal to the Dave Wasserman Redistricting app. This neutral app compares legislative district lines to the census numbers and past performance. This is a great way to compare the 4 maps in a quantitative way and cut through some of rhetoric being lauded from all sides. The four main areas of comparison are Proportionality, Competitiveness, Minority Representation, and Compactness. With all 4 statistical categories the higher you rank the better and the scores are ranked 1-100.
You can see all four maps on the App at the following links:
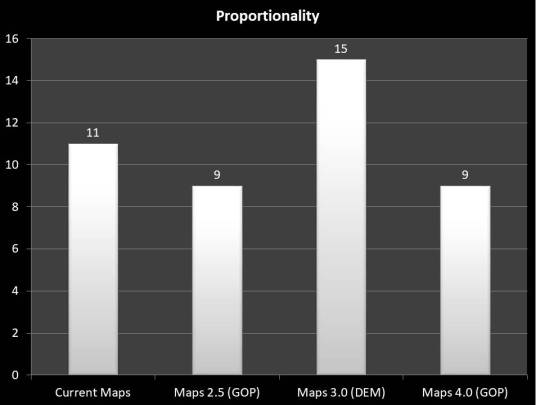
The first ranking of proportionality tries to measure the size of the districts in terms of land mass and how equal they are. This is hard to do on a county-wide level with a dense urban core and sparsely populated rural regions. It is notable though that in this statistic the Democratic map improves on the old district map whereas both GOP maps are rated worse than the oft criticized 2011 maps. Advantage Democrat 3.0.
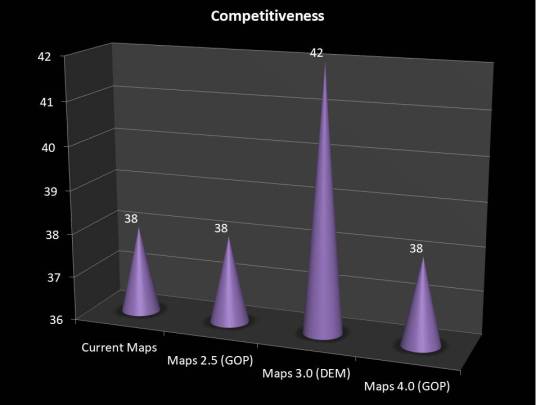
Competitiveness analyzes past performances of the districts in various elections as well as voter registration data to try and determine the likelihood of competitive districts. Once again the newly submitted GOP maps do not improve on the 2011 maps ranking as a tie. As expected from the partisan data I shared earlier the Democrat 2.0 map is rated as more competitive. Advantage Democrat 3.0.
A great deal of the discussion around the vetoed maps is around minority representation. The GOP maps cracks the only Black majority district and splits them into white plurality districts. They’re claim this is to prevent future lawsuits is baseless and flies in the face of redistricting practices in the last few cycles as well as the Voting Rights Act and newly signed State Redistricting guidelines. While their map 2.5 shows a slight improvement on minority representation from the old map, their map 4.0) is actually rated as a step worse. The Democratic map 3.0 ranks higher on this metric as it keeps the majority black district and refrains from unnecessarily pairing city neighborhoods with suburban neighborhoods. Advantage Democrat 3.0.
The final metric may be the most notable, compactness. These metric studies how compact the individual districts are and whether they needlessly have longer obtuse shapes. This is one of the more important attributes to the new state law and could be the crux of legal arguments along with minority representation. It also happens to be the starkest difference between the maps. The 2011 maps were criticized for their obtuse meandering shapes and it is again notable that both submissions of the GOP map were rated worse than the 2011 maps. The Democratic 3.0 map rates much higher on compactness making it more likely to keep communities together and have recognizable representation. Advantage Democrat 3.0.
It becomes clear looking at the objective statistics as well as the maps themselves that the GOP maps submitted will continue to divide Onondaga County and create needless partisan division. At the very least the Onondaga County Legislature should reject the maps, send them back to the Reapportionment commission and demand consensus maps that bridge these divides. Failing in that it is clear the Democratic maps are the better choice according to all metrics and shows a legally sound path for Onondaga County. A public hearing is scheduled to start at 11:30am on December 21, 2021 with votes immediately after. If you care about this issue you should attend and have your voice heard.
(h/t to Mike Stanton for uploading the data to DAR. He graciously allowed me to include it in my article.)
Today I talk about 4 pieces of legislation called up last week to protect and enhance absentee voting, expand Early Voting, and mandate online portal and tracking systems for absentees. I also address the maps being considered in the Onondaga County redistricting process.
In this week's episode I talk about the end of the petition season. over 155 petitions and 160 candidates have filed to run in the primary and general elections. I talk about the process and what is next in the petition process. Enjoy.
Dustin Czarny, Onondaga County’s Democratic Elections Commissioner, said the two proposals by Republicans change the makeup of District 16 to be 44% and 48% Black. The Democrat’s proposed map is 57% Black in that district.