This month’s Sunday Seminar I talk about Absentee voting in Onondaga County and New York State. Learn how to apply and vote absentee and the deadlines to do both so your ballot will count for out two primaries and the General Election.
Subscribe to dustinczarny.com for content and election news updates
In Onondaga County, turnout in the 2020 presidential election was 77% – the highest since the 1960s. The 2021 local election drew 31% of registered voters to the polls, Elections Commissioner Dustin Czarny said.
Today I sit down with Jessica Hess of the Women’s March Syracuse. We talk about the history of the organization both locally and nationally. We also talk about the perilous moment we are in with the likely demise of Roe v Wade in the Supreme Court. Enjoy.
subscribe to dustinczarny.com for all election news and content updates
Welcome back to #wonkywednesday. Each week I take a deep dive into the electoral and voter registration data that makes up our home here in Onondaga County and across New York State. Once again I revisit how redistricting is impacting our county. This time we take a look at the final maps ordered by the court for Congress and State Senate. After a long drawn out process we finally have the maps that determine the districts which our candidates will run to represent us this fall. I take a quick look at the changes from the old maps, the legislative maps ruled unconstitutional, and the final maps imposed by the courts.
The court has drawn Onondaga County into the #NY22 congressional district. This district contains all of Onondaga, Oneida, and Madison County. Curiously it also contains a portion of the village of Cleveland on the north shore of Oneida Lake in Oswego County as well. For the purpose of this article I can’t really include those 340+ lost souls in the data yet. This district is a radical change from the old #Ny24 which went North and west encompassing Cayuga, Wayne and a Portion of Oswego County. The Legislative maps ruled unconstitutional had Onondaga County in the center pf a district going southwest encompassing Cayuga and portions of Geneva, Cortland and all of Tompkins county as well as goring east through Madison and into Utica. According to Dave’s Redistricting App released by the special master the new #NY22 is a D+5.1 and deemed a competitive district.
Compiling registration data from the three main counties in the district #NY22 is dominated by Onondaga County which makes up 63% of the district. Madison country is 9% and Oneida County is 28%. Enrollment wise Democrats have a plurality at 35%, Republicans at 31%, and Non-Enrolled at 26%. While Democrats have the edge on paper we have to look into the performance of the district to see exactly how this new district might perform.
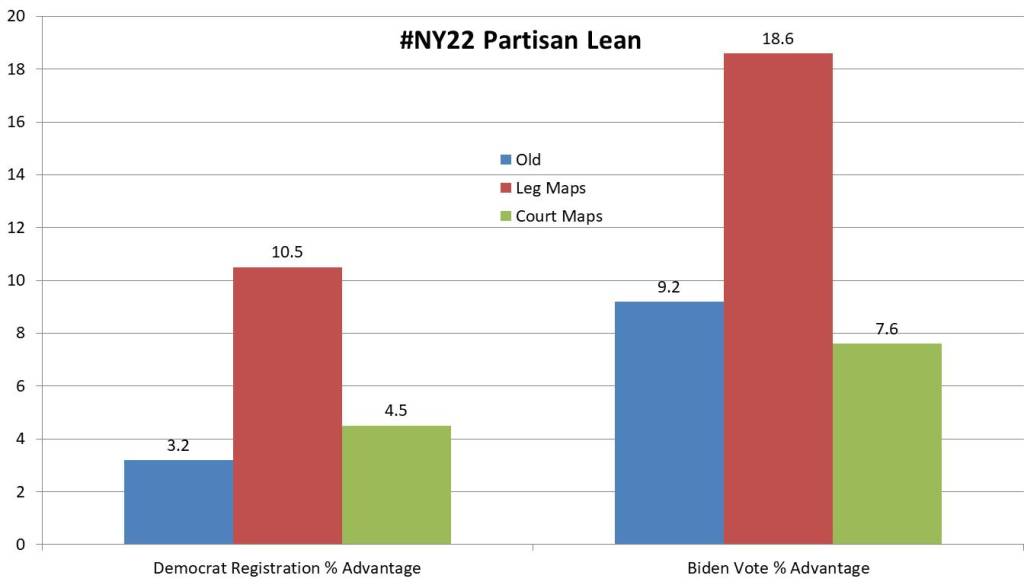
It is helpful to see how this district evolved over the three variations we have had since the beginning of redistricting in January. The old #NY24 had a Democratic enrollment edge of +3.2% and the district voted for Biden in 2020 by +9.2%. The district the NY Legislature sought to create grew the registration advantage to +10.5% and that new district would have voted for Biden by a commanding +18.6%. The final district has a +4.5% enrollment advantage for Democrats and the district voted for Biden at a rate of +7.6%. So Democrats make up a higher percentage of the enrollment population from the old district, in performance it did not support Biden as much. One possibility here is the non-enrolled portion of the new #NY22 is more conservative than the old #NY24.
The new #SD48 may be the district that has gone under the most dramatic change throughout the entire legislative process. The original district encompassed most of the City of Syracuse and went north through Salina and Cicero, south through Fabius, Pompey, Lafayette and Tully into Madison County and had a tiny portion of Oneida. The legislative maps took out Salina and Cicero and added portions of Cortland and even more of Oneida County to add Utica. The final maps by the special master flip the switch, after first having a draft that had #sd48 in the north of Syracuse, the final map has the City of Syracuse wholly inside it with Lysander, Van Buren, Elbridge, Marcellus, Onondaga, Onondaga Nation, Lafayette, Pompey, Spafford, Otisco, Tully, Fabius as well as going west to capture all of the county of Cayuga. Dave’s Redistricting App rates this as A D+16.8 and seen as a safe Democratic seat.
Onondaga County once again dominates this district making up 75% of the voter enrollment with Cayuga County making up just 25%. The enrollment of the district is definitely leaning clue. Democrats makeup the plurality of the district at 39%. The GOP is just 28% of the district with the non-enrolled right behind at 26%. 3rd parties makeup the rest of the 7% of the district. The cities of Syracuse and Auburn being wholly inside the district certainly lends to the blue tinge of the voter registration.
This is one of the rare districts that Democrats may have benefitted from the Special Master than their own legislative lines. The old district (#sd53) had a Democratic registration lean of +13.65 points. The NY legislative maps actually made the district a little more Red, dropping the registration advantage to 13.22, and the courts dropped it even further to 11.93. However in terms of performance this district is just as strong as the old district and stronger than the legislature maps for Democrats. The old district voted for Biden by 18.6 points, the legislature maps voted for Biden by 16.8 points, and the court final maps voted for Biden by 18.2 points. Even tough the district area has changed and even less Democrats in it, it seems the district performs the same as the old #SD53.
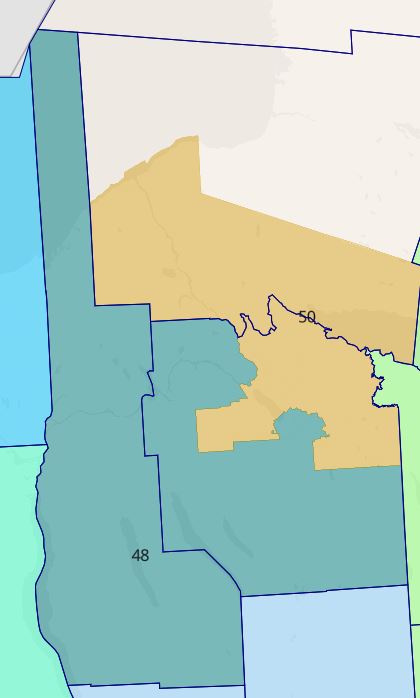
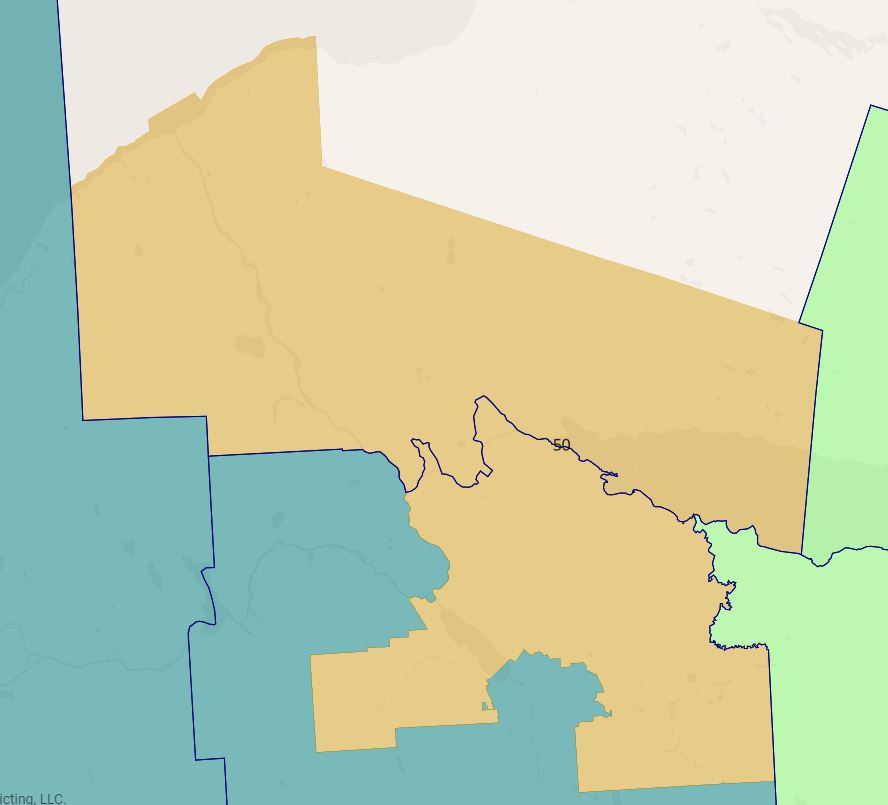
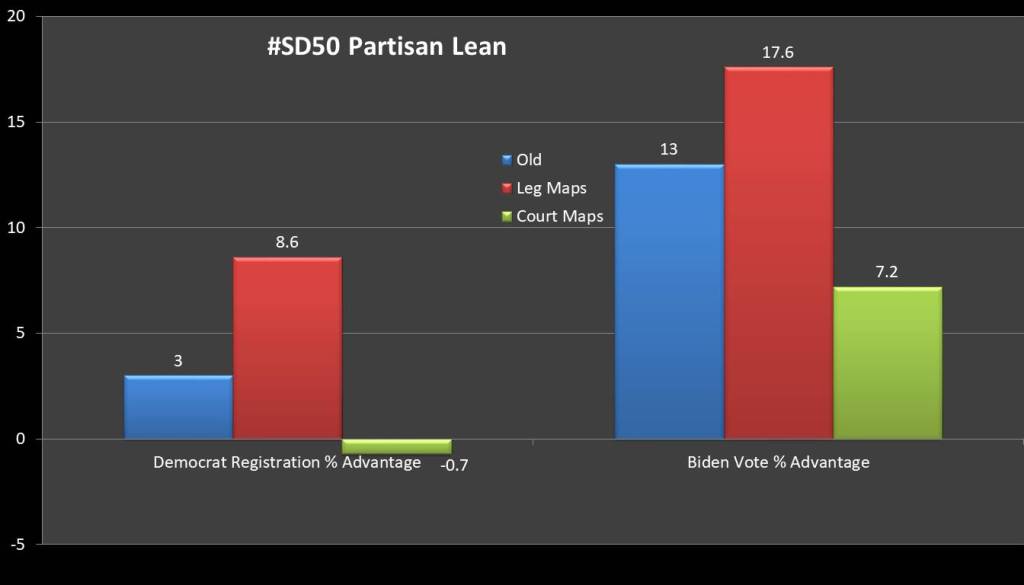
The final map we will look at today is the new #SD50. Much like its companion Senate district it has been a subject of much change. The original map had a sliver of the north side of Syracuse along with the towns circling counter clockwise around Syracuse from Clay all the way over to Onondaga and also included eastern towns of Dewitt and Manlius as well as a parts of Auburn and northern Cayuga County. The legislative map shifted the Cayuga County portion south encompassing all of Auburn, getting out of the southern portion of Onondaga County and picking up Salina and the northwestern third of Syracuse. The draft map for the courts altered the district having it go east to Utica before the final map shifted it north settling on the towns of Camillus, Geddes, Salina, Clay, Cicero, Dewitt, & Manlius with the cities of Fulton & Oswego as well as the southern half of Oswego County. Dave’s Redistricting App rates this as a Dem +3.9 district and rated very competitive.
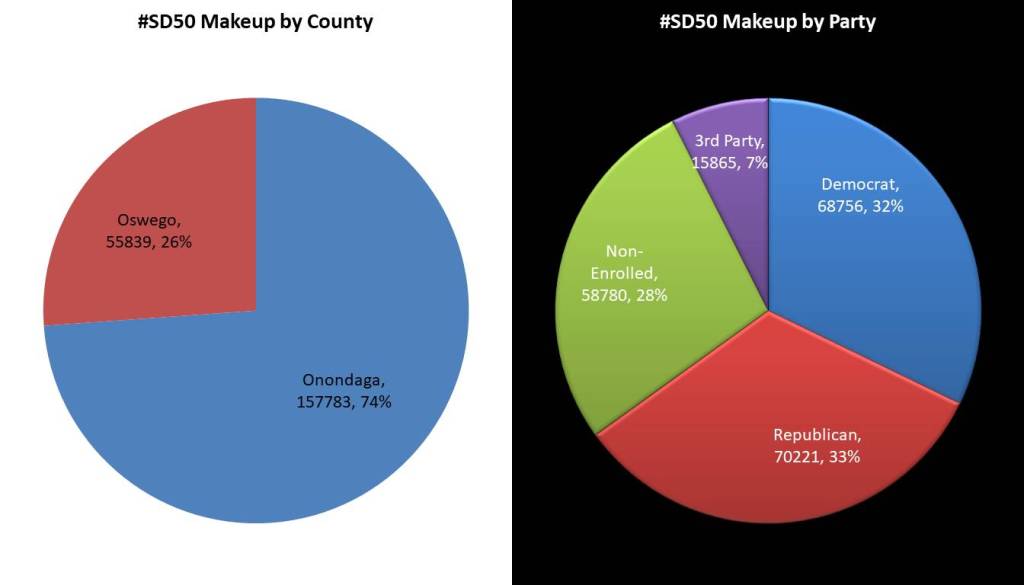
Onondaga once again makes up 74% of the voting population of the new #SD50 while Oswego County is at 26%. Despite the DAR rating there are actually more Republicans in the district with 33% of the voting population trailed just behind by the Democrats with 32%. Non-enrolled is 28% and 3rd party voters once again at 7%. The Oswego County portion of the district is heavily GOP while the Onondaga County is slightly Democratic, but more numerous making this about as even a district as possible.
While both of the other Onondaga County Districts ended up near the metrics they started off with, this district has had a clear direction toward the GOP in the court ordered maps. The old district had a voter registration advantage for the GOP at 3.0, the legislative maps grew that by 8.6 points, the court ordered maps gave the GOP a .7% registration advantage. Performance wise the district took a hit as well. It went from a +13 Biden district, to +17.6 under the legislative plan, to just +7.2 Biden advantage in the final map. All of these metrics point to a very competitive seat that could flip either way in a normal election year.
Later this year I will do a deep dive into all three of these districts investigating the individual registrations of the various communities. Until then we have until June 10th this year before we know the full candidates field. Previous candidates have until May 31, 2022 to file a certificate and new candidates have until June 10, 2022 to turn in petitions. The primary for these seats will be August 23, 2022.
Back in Onondaga County, voters might have some whiplash over changes to the state senate map and the area’s two main Senators John Mannion and Rachel May. Czarny can understand if voters might be confused.
“These are radically different senate districts than we’ve seen in the previous versions of any of the maps, and it’s something people are still trying to wrap their head around. Both district are democratic leaning districts, but the Mannion district is more competitive, kind of like it is now, just in different areas.”
Today I dissect the new Congressional and State Senate maps drawn by the Special master. I also talk about the candidates who have announced, their path to the nomination, and whether they are appearing on the august 23rd primary ballot. Enjoy.
Known Candidates for #NY22 Dems: Francis Conole, Sarah Klee Hood NY, Chol for Congress GOP: Brandon Williams for Congress – NY 22nd District, Steve Wells For Congress
This week I site down with two of the City of Syracuse Independent Redistricting Commission, Jason Belge and Jacqueline Lasonde. They reveal their draft map for the City of Syracuse 5 district council seats. They will have 5 more meetings on this where you can give feedback before the release a final map. Find out more here:
Czarny understands that redistricting can be an uphill battle and causes confusion amongst not only voters—but also elections professionals and even candidates—which is why he’d like to see the process changed.
“I’d much rather see a process where citizens are doing the redistricting, as we see in the city of Syracuse, as opposed to when politicians get involved, and then we have to go to court because people don’t like the way they draw their lines.”
Welcome back to #wonkywednesday. Each week I take a deep dive into the electoral and voter registration data that makes up our home here in Onondaga County and across New York State. It is that time of year where I start to focus on the races this fall and the registration data that makes them up. With statewide elections happening this year I decided to investigate New York State as a whole. Here is what I found looking at the Empire State.
It will surprise no one that New York is a blue state. Republicans have not won a statewide office since George Pataki ended his 12-year run as governor in 2006. Since then, not only has the GOP gone winless in State-wide elective office, often the race is not even close. Democrats have 5,929,375 enrolled members, making up just over a majority of all voters in the state. The Non-Enrolled are now second most populous group with 2,713,757 voters (23%), Republicans are now in third with just 2,645,799 (22%). Conservatives have 152,669 (1%) and Working Families Party has just 45,093 (0%). Though Conservatives and WFP make up the two other recognized parties there are still 419,193 voters enrolled in formerly recognized parties or other parties.
Regionally New York is generally considered to be broken up into three different distinct sections. New York City and the five counties that make up the City proper (Bronx, Kings, New York, Queens, Richmond) account for 4,611,360 voters (39%). The NYC Suburbs are generally considered the four counties directly bordering NYC. They consist of the two long Island counties of Nassau and Suffolk and the two counties that sit directly to the north Rockland and Westchester. Together they contain 2,808,825 voters (23%). The Non-NYC counties make up the Hudson valley, southern tier, western and central New York as well as Upstate New York. To avoid getting into the various debates about where each of these regions lie it is helpful to show them together as the non-NYC contingent. They make up 4,485,701 voters (38%).
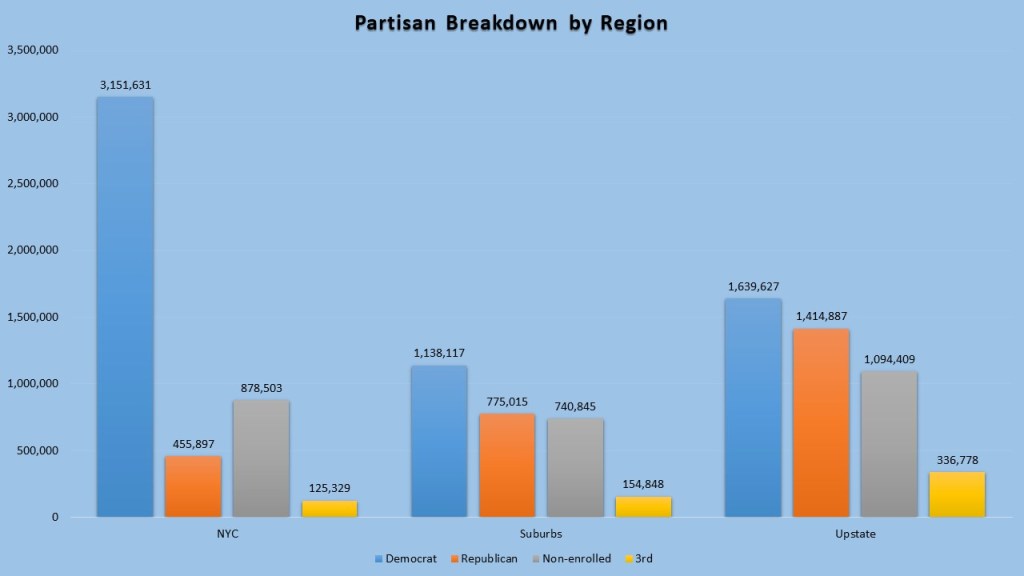
While each region varies in their partisanship, specially from county to county, the regions as a whole are generally Democratic. New York City NYC (3,151,631 Democrats (68.3%), 455,897 GOP (9.9%) and 878,503 & non-enrolled (19.1%) is overwhelming Democrat with the non-enrolled not just outnumbering but over double the GOP. In the Suburbs things get a little better for the GOP but Democrats still have a Plurality of voters (1,138,117 Democrats (40.5%), 775,015 GOP (27.6%), 740,845 non-enrolled (26.4%)). The Non-NYC rest of New York State the GOP fares the best but even their Democrats have a small plurality (1,639,627 Democrats (36.6%), 1,414,887 GOP (31.5%), 1,094,409 non-enrolled (24.4%)).
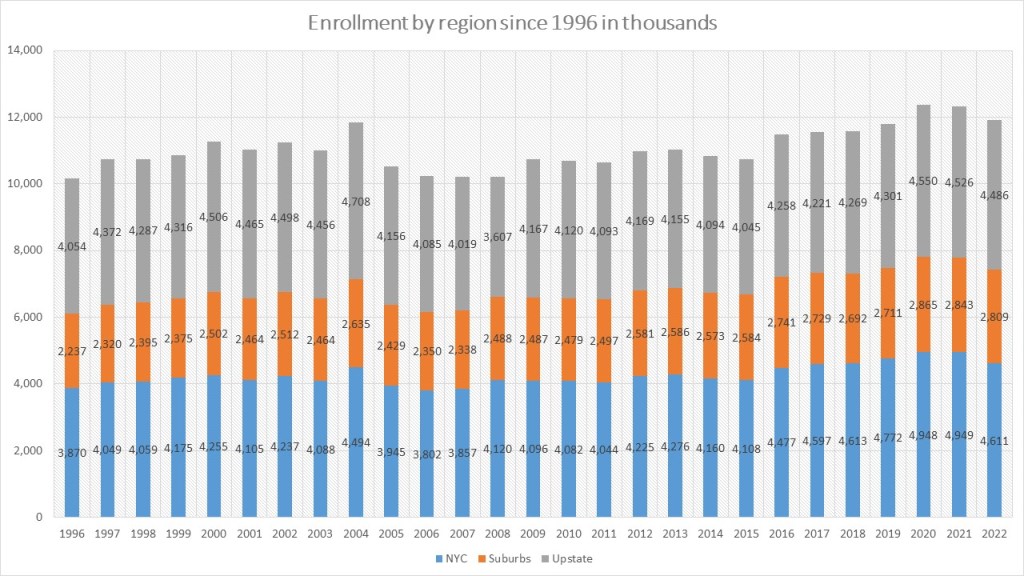
New York State Voter Enrollment has grown dramatically since 1996. In 1996 New York had 10,162,156 voters. That had grown in February of 2022 to 11,905,886, a growth of 17.2%. New York City has grown as well at a rate of 19.1% with the suburbs of NYC growing the fastest at 25.5%. Non-NYC counties saw a lagging growth rate of just 10.6%. This resulted in a shift in New York voting power downstate. The Non-NYC counties were more populous in 1996 accounting for 39.9% of the voters but fell to 37.7% of the voters. New York City grew its share of New York voters slightly from 38.0% to 38.7%. However, the NYC suburbs have seen the largest vote share gain growing from 22.0% to 23.5%.
Finally, since 1996 New York Democrats have had a steady but robust growth in its population. Democrats have added 1.2 million voters since 199. However, it is the non-enrolled that have added the most, growing their ranks by 1.6 million voters. The GOP has lost approximately 350k voters during that same time period. In 2020 the Non-enrolled finally caught up to and surpassed the GOP and that trend does not seem to be changing anytime soon.
The Demographics of New York State have been clear. It is not only a blue state, but also getting bluer with each passing year. The 2016 election of Trump has helped in that process, but New York GOP has seen a long steady decline since 2004. The primary for Governor is on June 28, 2022, and we will have a set of statewide candidates for each office. Democrats will be the overwhelming favorites for the fall elections and Republicans will be battling a long trend of losing political influence on a state-wide level.
This week I talk about the draft maps released by the Special Master Johnathan Cervas. These maps, if approved, will serve as the NY congressional maps for the August 23, 2022 primary and for the next ten years.